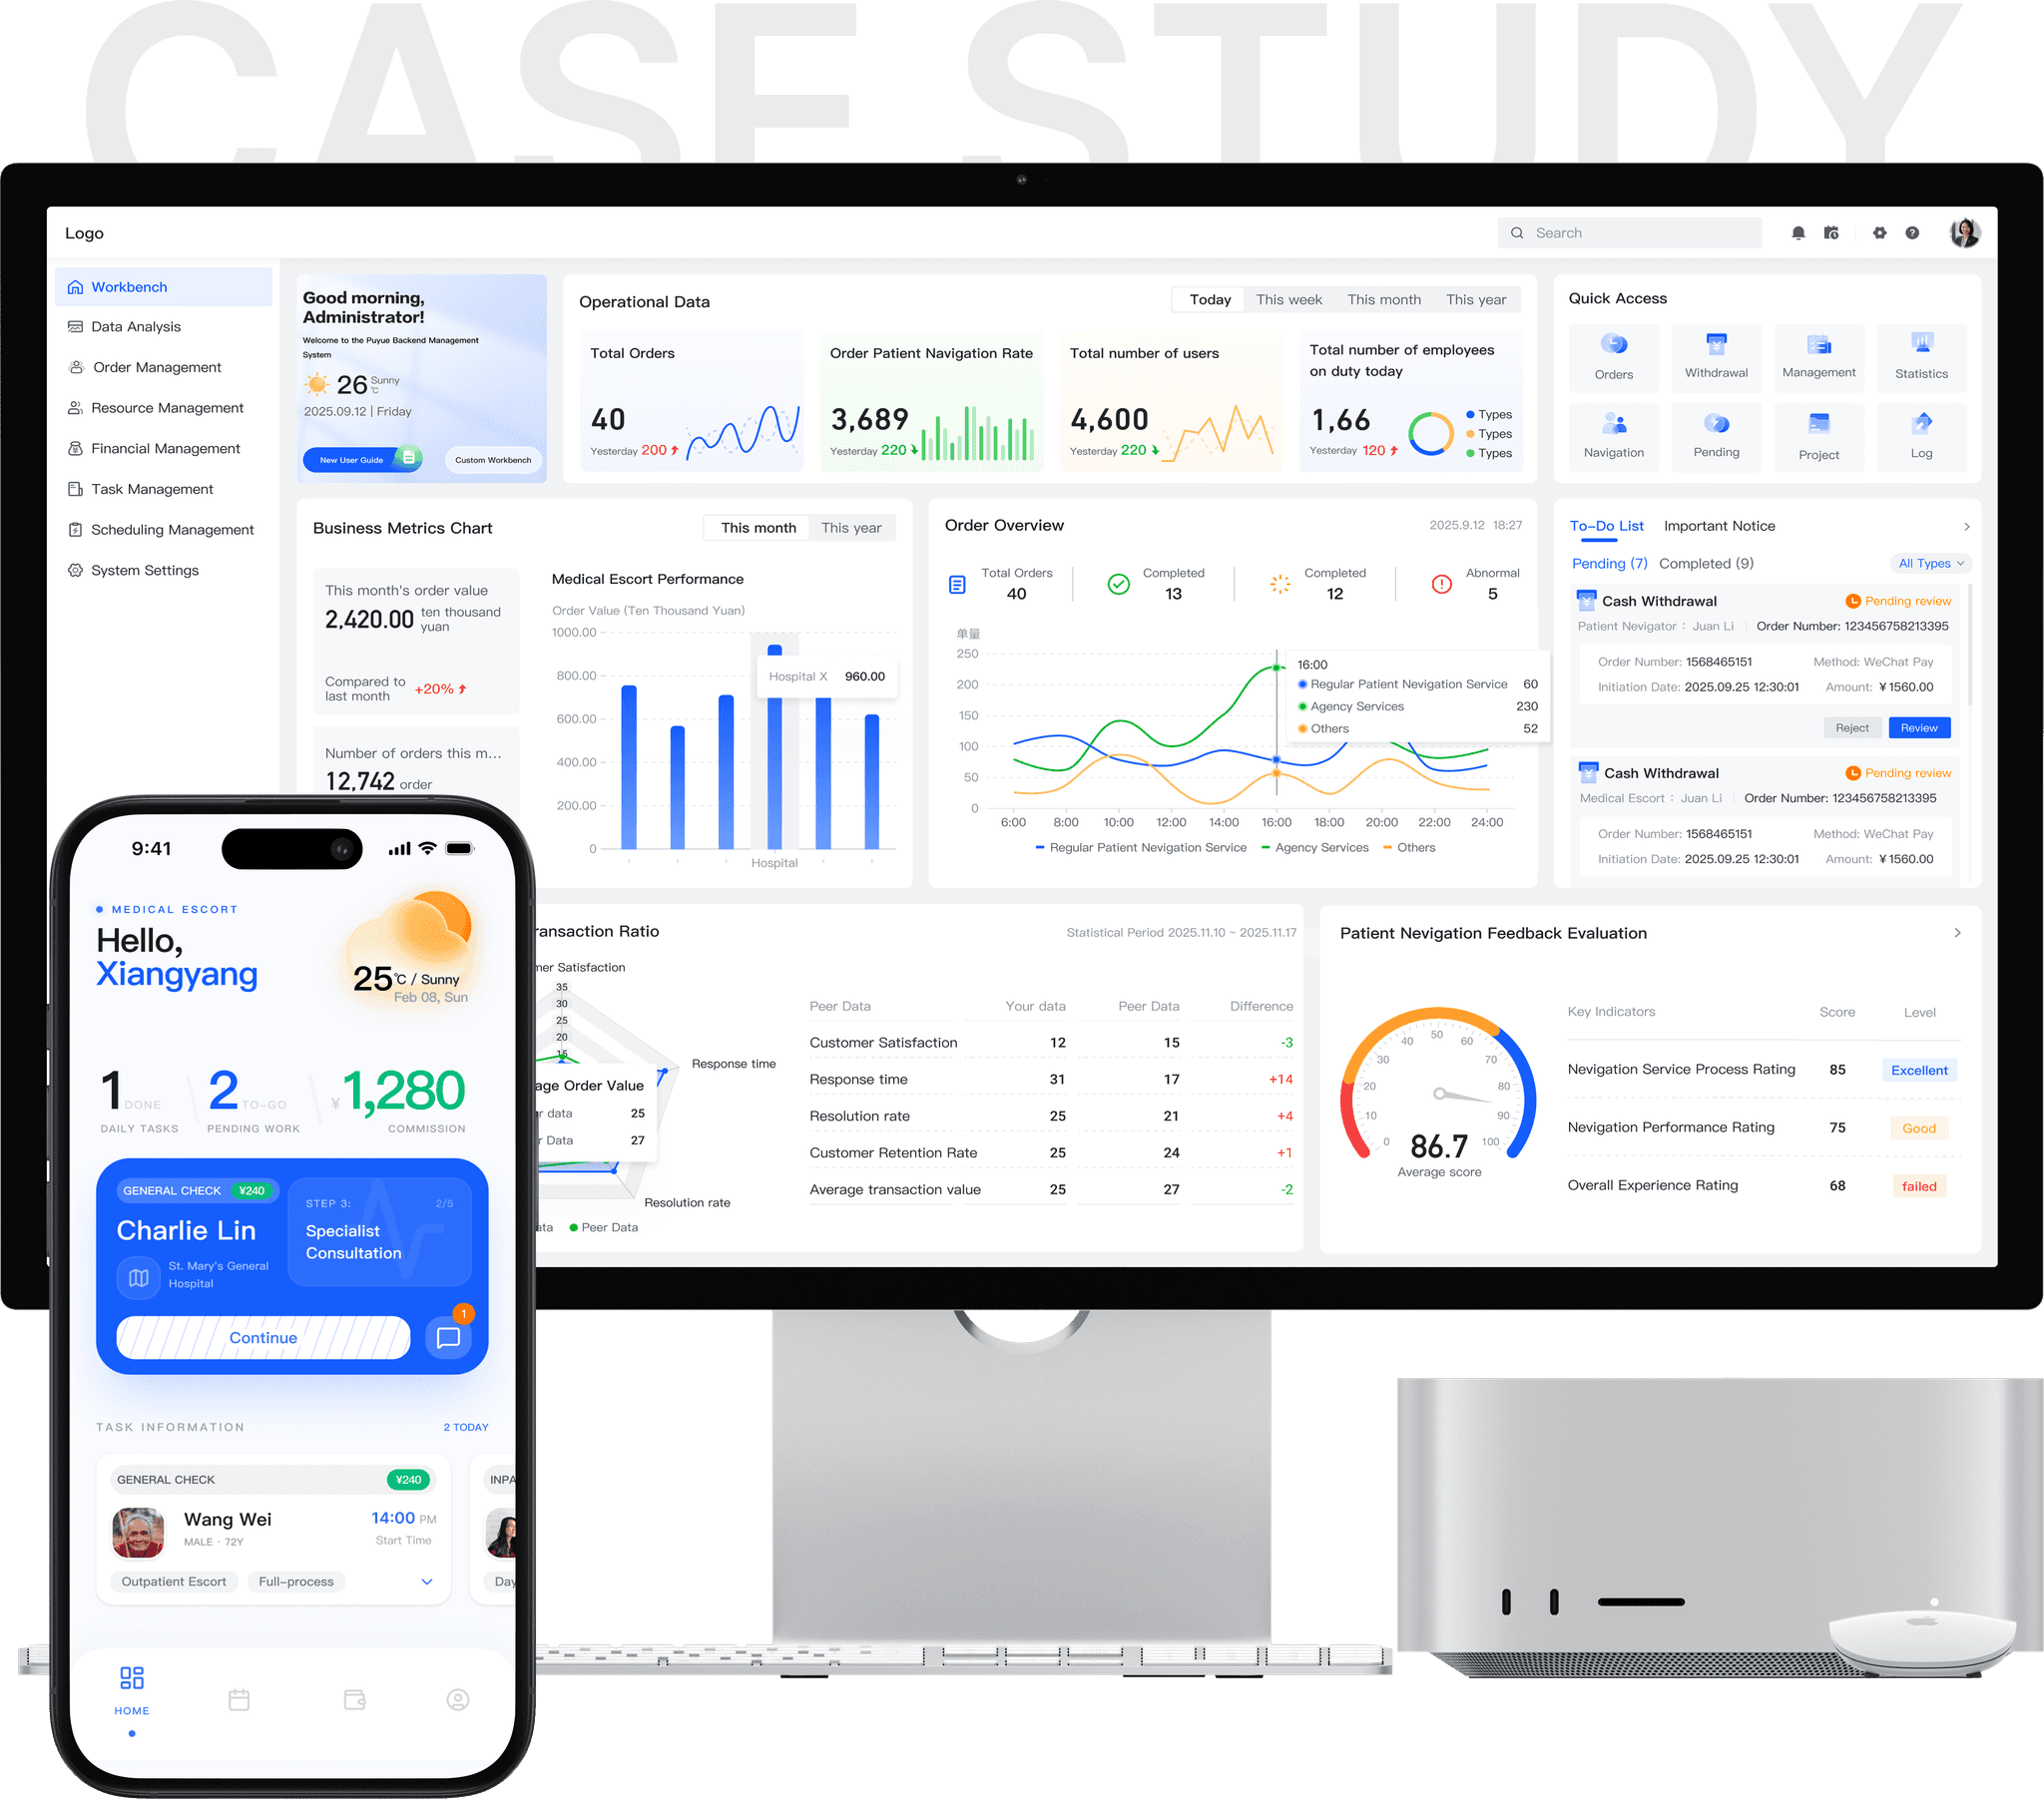
Puyue MCS — one patient navigator system across web, mobile and mini program
UX design in practice: from breaking down a complex business scenario to a consistent experience across devices.
Qualitative research, concept design, usability testing
3 months
Mobile app
Mini program
Lili Zhang
Patient navigation · B2B2C · China
My contribution
I owned the dashboard experience for a multi-platform patient navigator system, translating complex operational workflows into actionable insights. I contributed to early user research and led the end-to-end dashboard design for administrators and operators.
Overview
Connected operations staff, navigators and patients through one system, each with their own interface.
“Coordinating navigation services across patients and navigators often feels like solving a puzzle with missing pieces.”
This is not just a dashboard, an app or a mini program. It’s a multi-platform collaborative navigation system that brings structure, visibility and confidence to a fragmented hospital service experience.
Through role-specific interfaces, the system turns complex, cross-department workflows into a shared, manageable operation. Instead of relying on personal experience and manual coordination, teams see what’s happening now, what needs attention next, and who is responsible.
Operations staff
Oversee scheduling, task assignments and resource allocation across multiple escort staff and patients.
Patient navigators
Work on the ground in hospitals: departments, check-ins, navigation and coordination throughout each visit.
Patients
Interact with the system during hospital visits, often in stressful, unfamiliar environments.
Problem
Navigation services ran on fragmented systems and manual coordination.
Imagine being a patient navigator on a busy weekday in a tertiary hospital. You’re coordinating several appointments, moving between departments, updating patients and families, and reacting to schedule changes, all at once.
In reality, navigator services operate across fragmented systems and heavily manual workflows. Frequent follow-up visits and cross-department dependencies make coordination much harder.
Only 42% of navigator service providers have standardized SOPs.
Waiting-time deviation caused by cross-department coordination.
Handoffs per visit, without shared visibility of progress.
But complexity does not resolve itself.
Research
Found that breakdowns came from visibility gaps, not from individual performance.
In high-frequency, cross-department medical settings, coordinating escort processes on human experience alone is nearly impossible. We set out to see where it breaks.
0.5–8+ years’ experience
We ran semi-structured interviews with escorts across tertiary hospitals and outpatient clinics, and interviewed patients and coordinators to triangulate. Sessions were recorded with consent, transcribed, and coded with affinity mapping in Miro. Patterns clustered around decision-making under pressure, escalation triggers, information handoffs and visibility gaps.
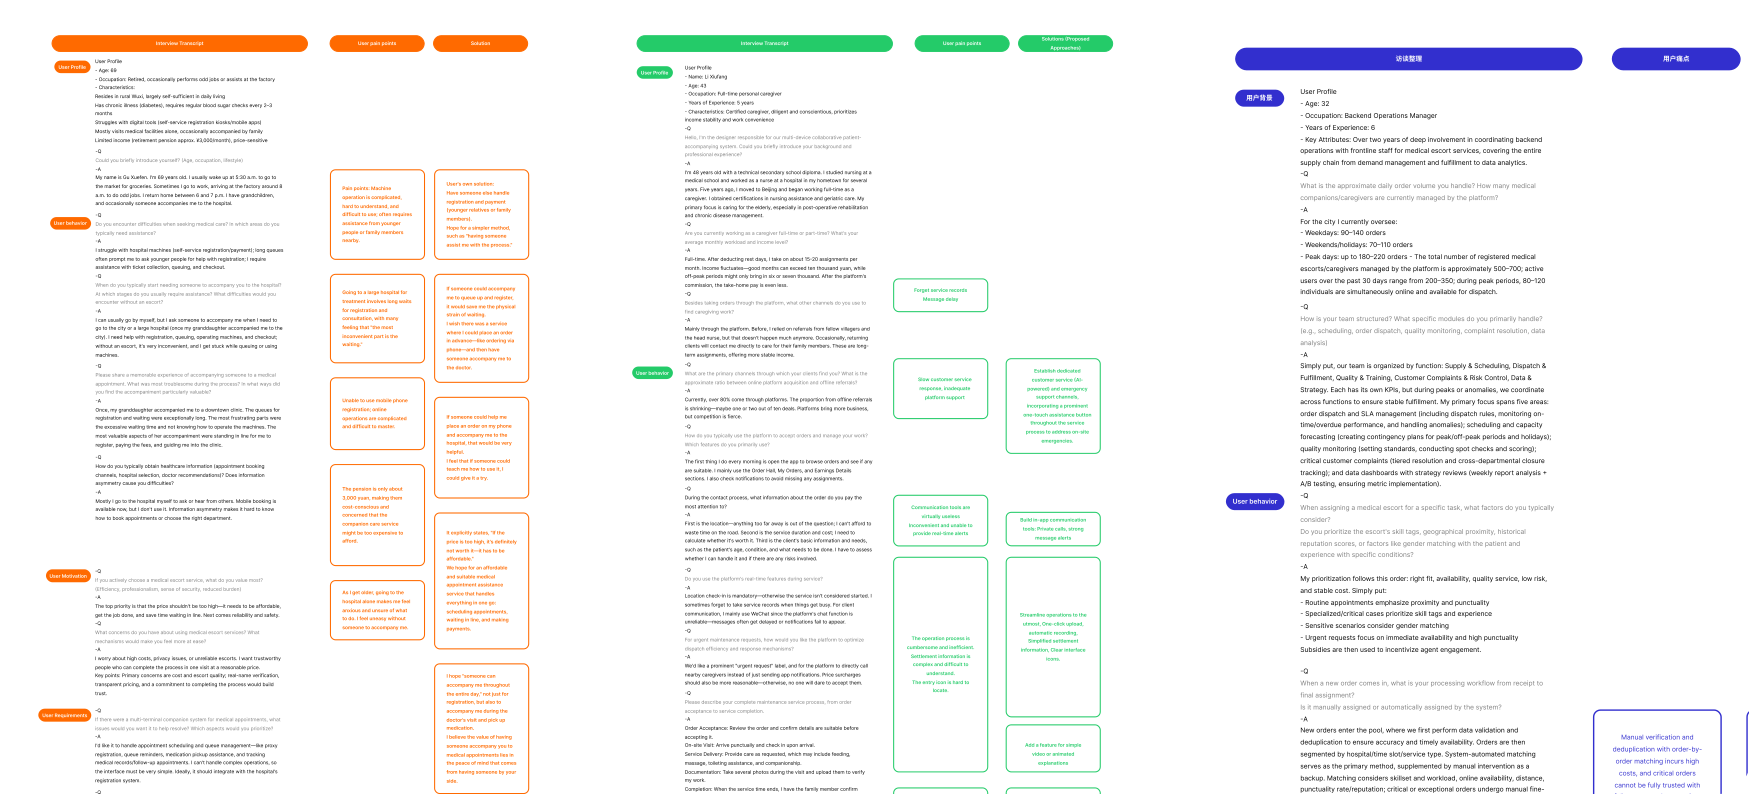
Common pain points
No holistic view
Teams see only fragments of the workflow and piece task status together across tools.
Issues found late
Conflicts and overloads surface only after they escalate, adding last-minute coordination.
Reliance on experience
Without system support, priorities depend on personal judgment: slow onboarding, uneven quality.
A multi-role journey map
Insights were synthesized into cross-role journey maps and personas. Mapping all three roles across one visit, from booking to follow-up, shows where each loses sight of the others.
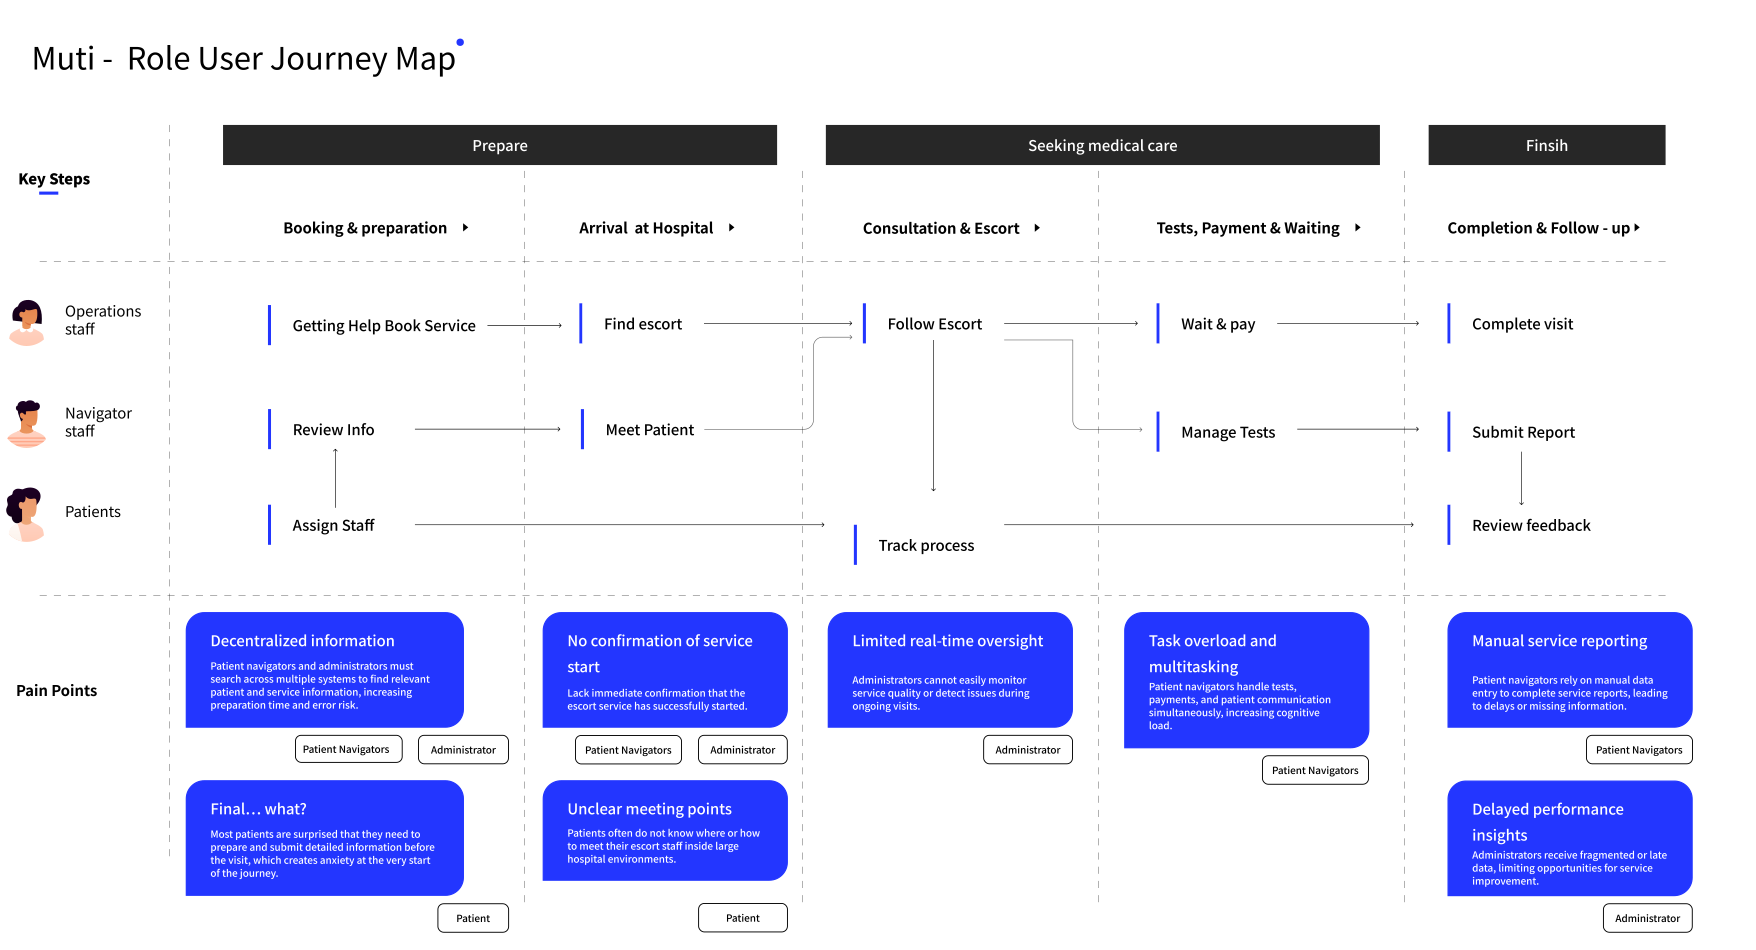
Structural, not personal
Coordination breakdowns stemmed from structural visibility gaps rather than individual performance.
Synthesis
Designed for what each role needs to see, decide and act on at any moment.
Focusing on each role’s moment-to-moment needs turned complex escort journeys into clear, actionable experiences, without overwhelming anyone with information they don’t need.
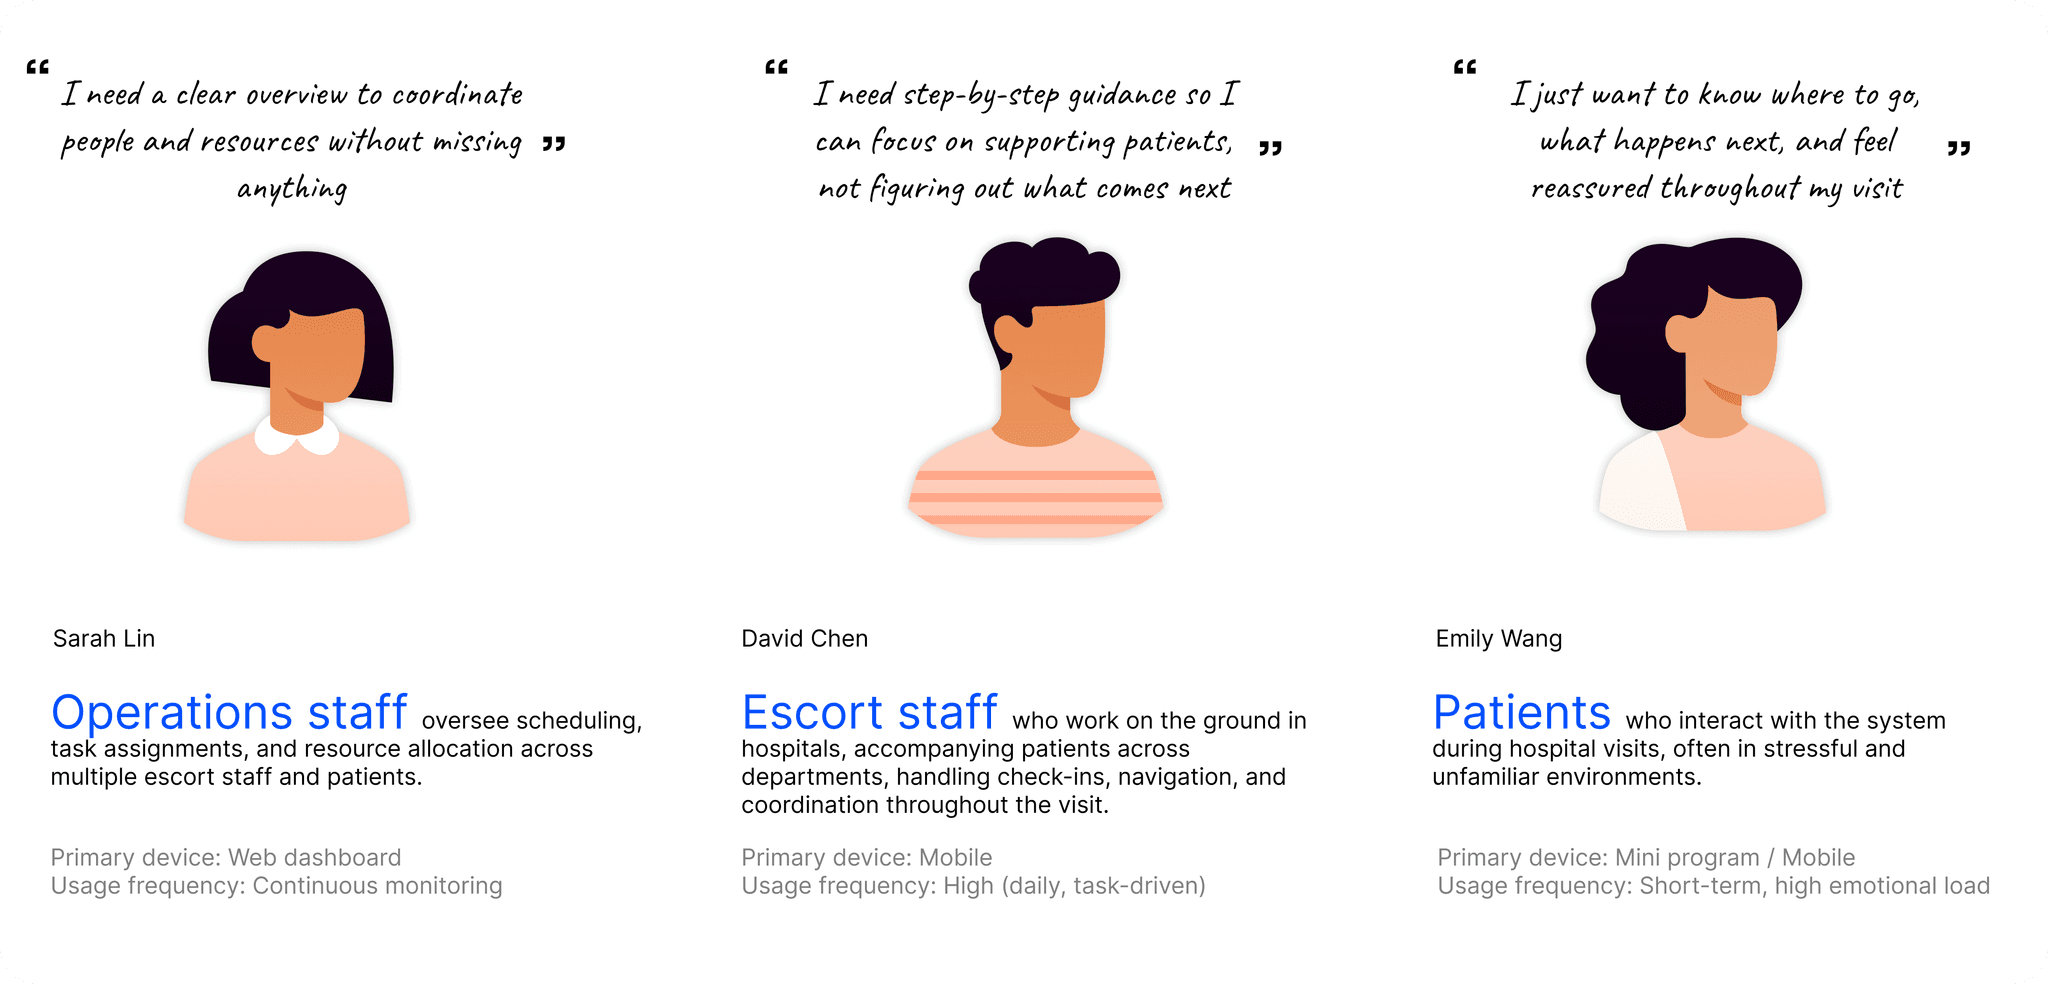
Three roles, three perspectives
“I need a clear overview to coordinate people and resources without missing anything.” Web dashboard, continuous monitoring.
“I need step-by-step guidance so I can focus on supporting patients, not figuring out what comes next.” Mobile, high-frequency daily use.
“I just want to know where to go, what happens next, and feel reassured throughout my visit.” Mini program, short-term use, high emotional load.
One shared system behind three interfaces
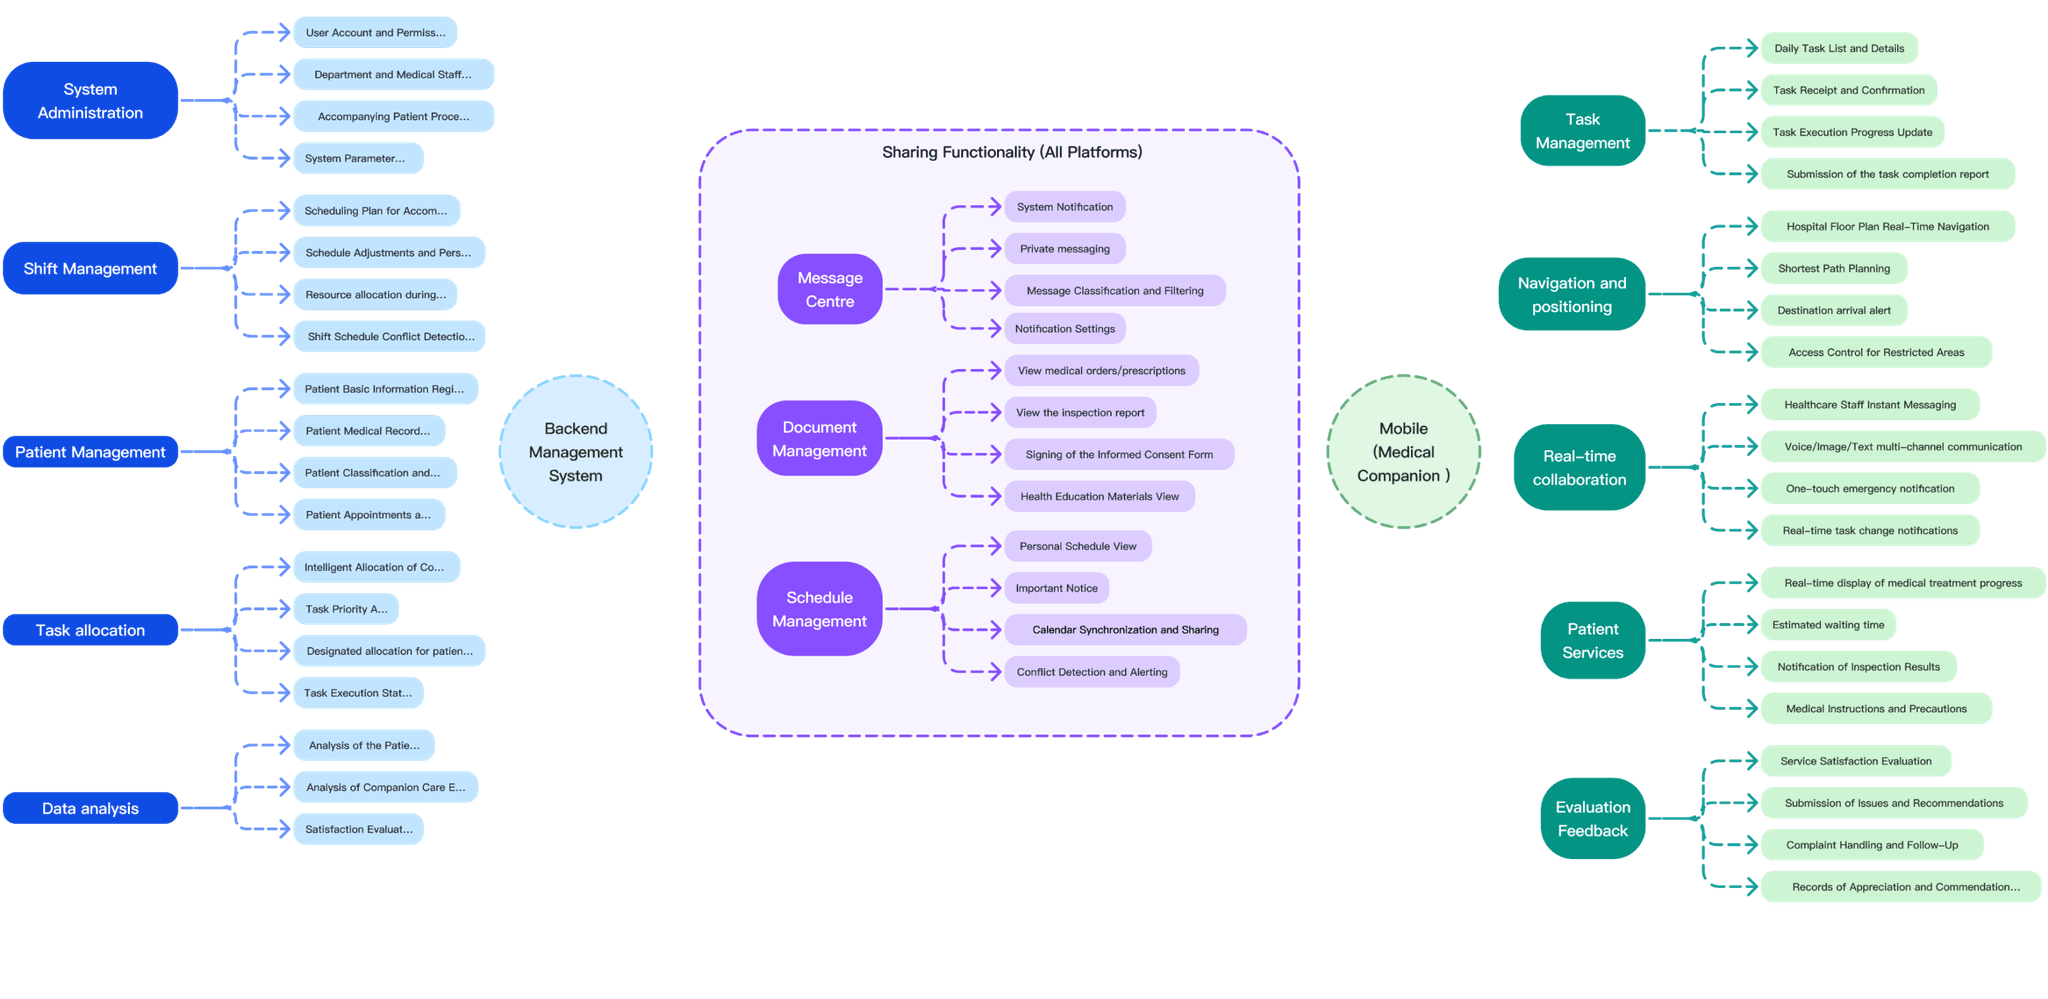
Messages, documents and schedules are shared across all platforms; the backend runs administration, shifts, patients, task allocation and data analysis, while the mobile companion handles tasks, positioning, real-time collaboration and feedback.
Dashboard
Led the web dashboard: one workspace for scheduling, tasks, finance and people.
The admin dashboard is where operations staff run the service. Each part below solves a piece of the same goal: less hunting for information, fewer steps per task.
Navigation
Modular, scalable architecture
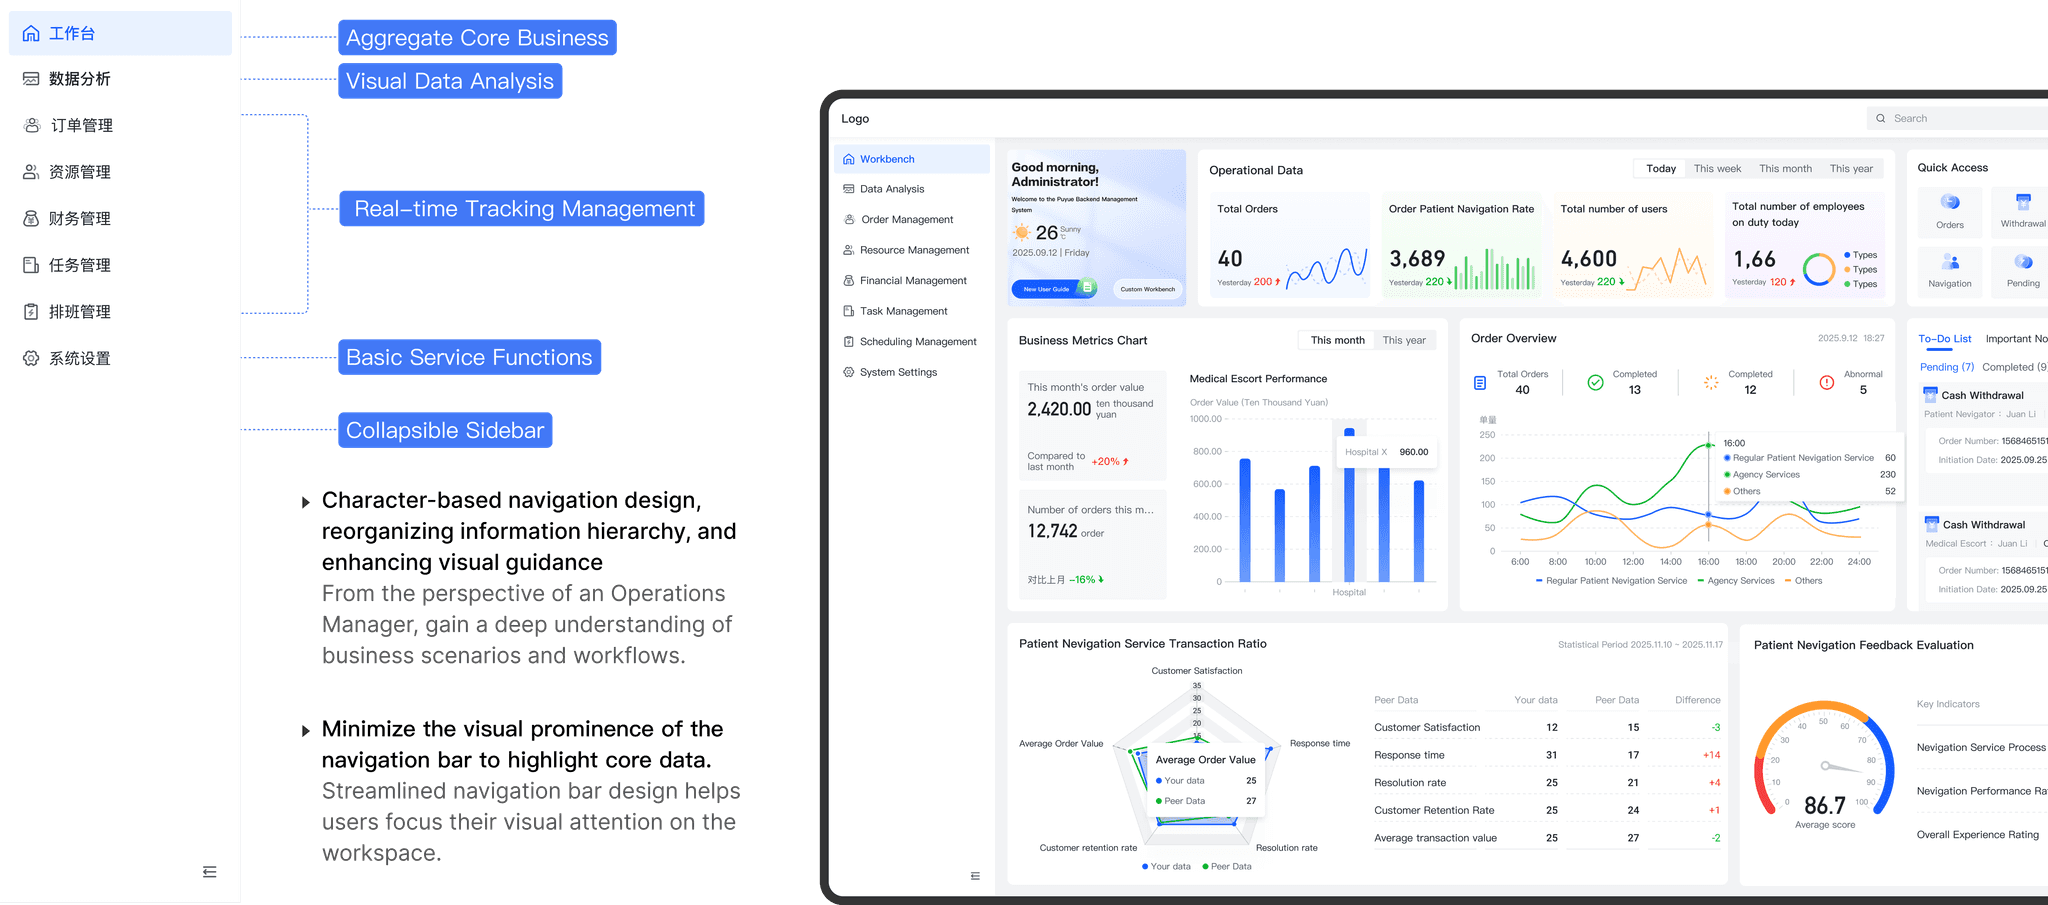
Integrated navigation turns complex business logic into role-aware workflows: aggregate core business, visual data analysis, real-time tracking, basic service functions, and a collapsible sidebar.
- Role-based navigation. Designed from an operations manager’s view of the business and its workflows, reorganizing the hierarchy and guiding the eye.
- A quieter navigation bar keeps attention on the core data in the workspace.
Workbench
Aggregate core tasks for streamlined operations
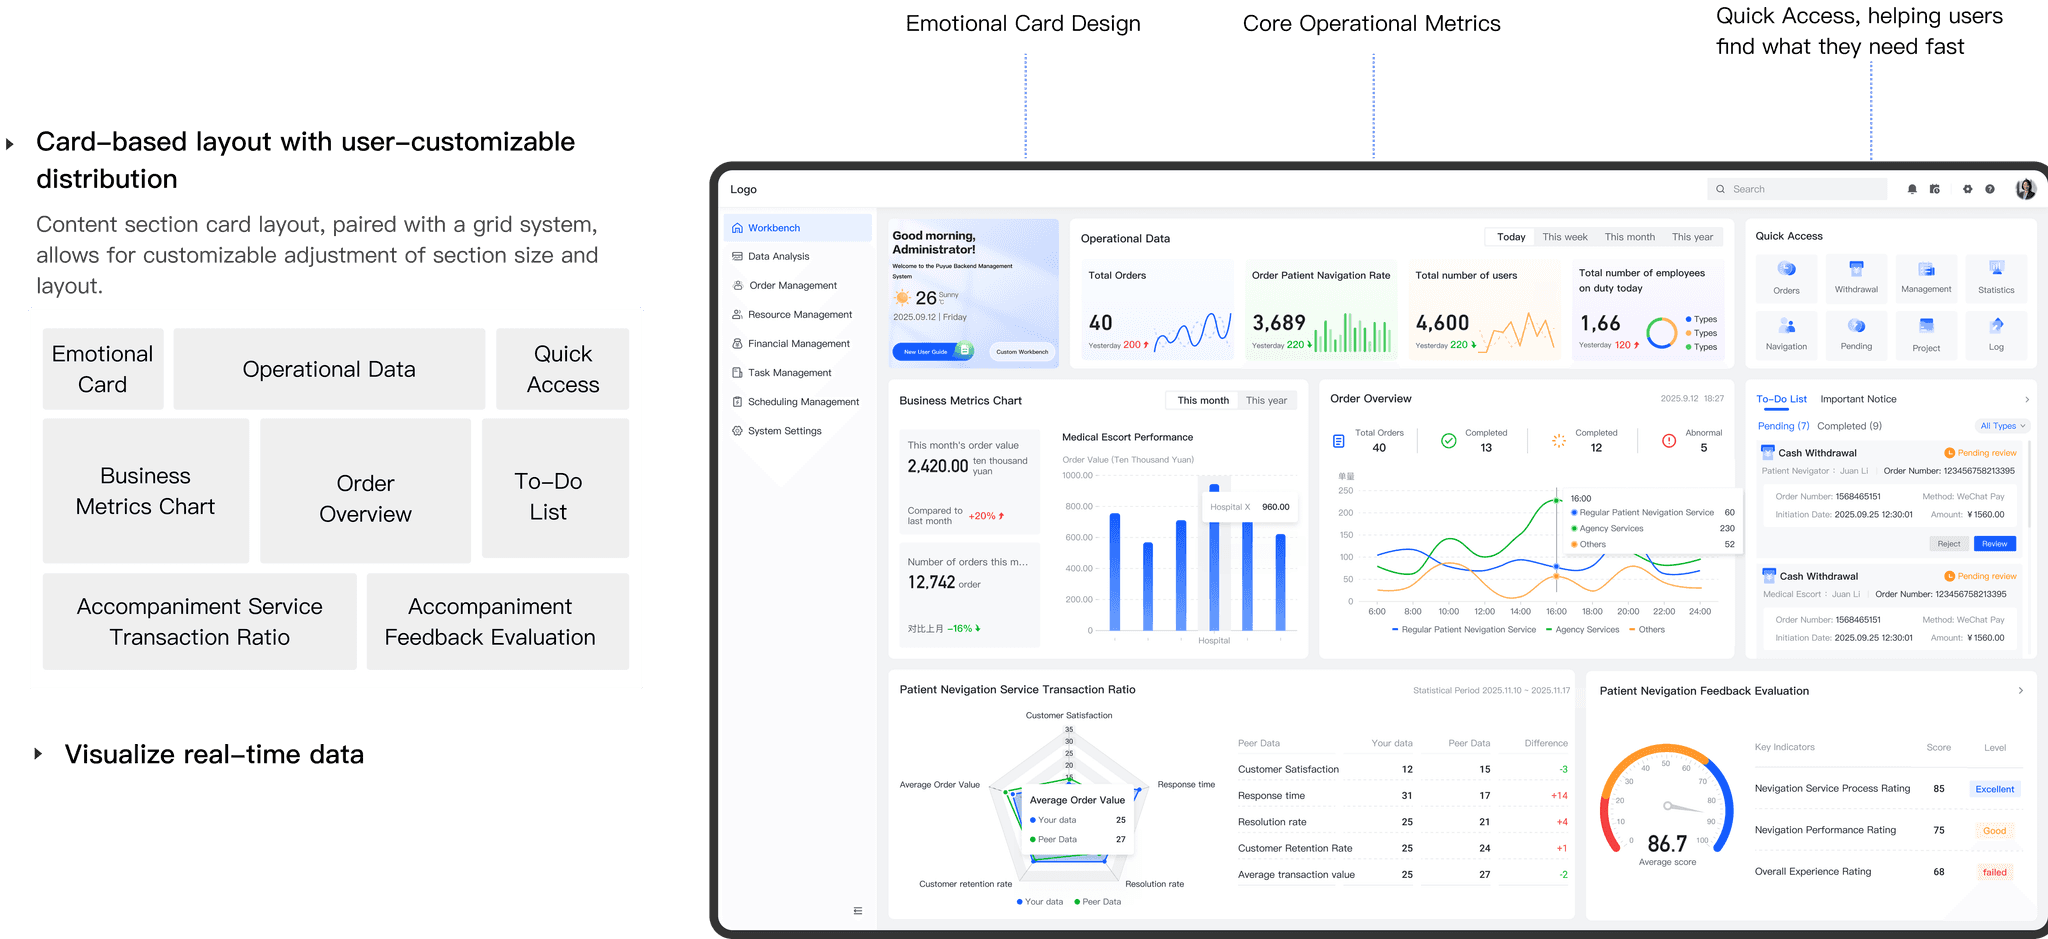
The workbench shows pending tasks, today’s schedule and real-time order status in one place: the main touchpoint for collaboration, with less information clutter.
- Card-based layout on a grid that users can rearrange: emotional card, operational data, quick access, business metrics, order overview, to-dos and feedback.
- Real-time data on orders, navigation rate, users and staff on duty.
Finance
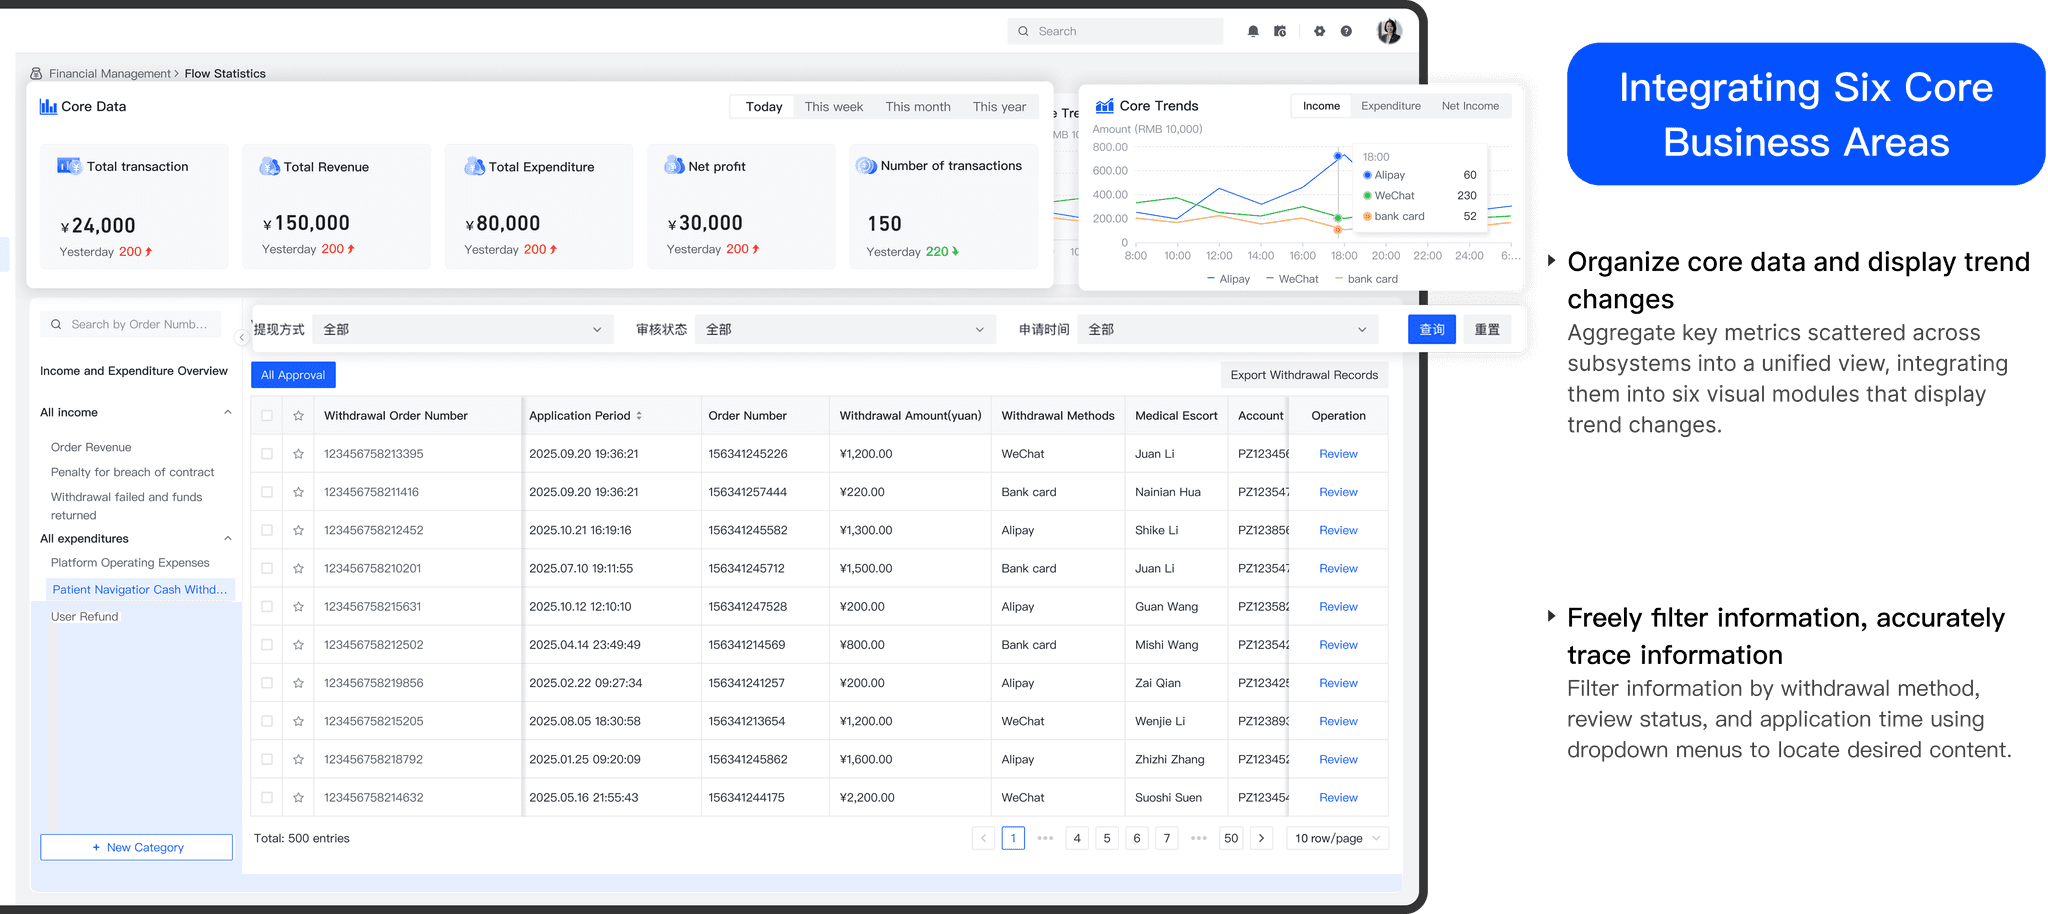
Six core business areas in one view
Frequently used modules are organized by business function, so common tasks are in one place.
- Organize core data and show trends. Key metrics scattered across subsystems become six visual modules that show change over time.
- Filter freely, trace accurately. Dropdowns for withdrawal method, review status and application time find the right record.
Detail pages
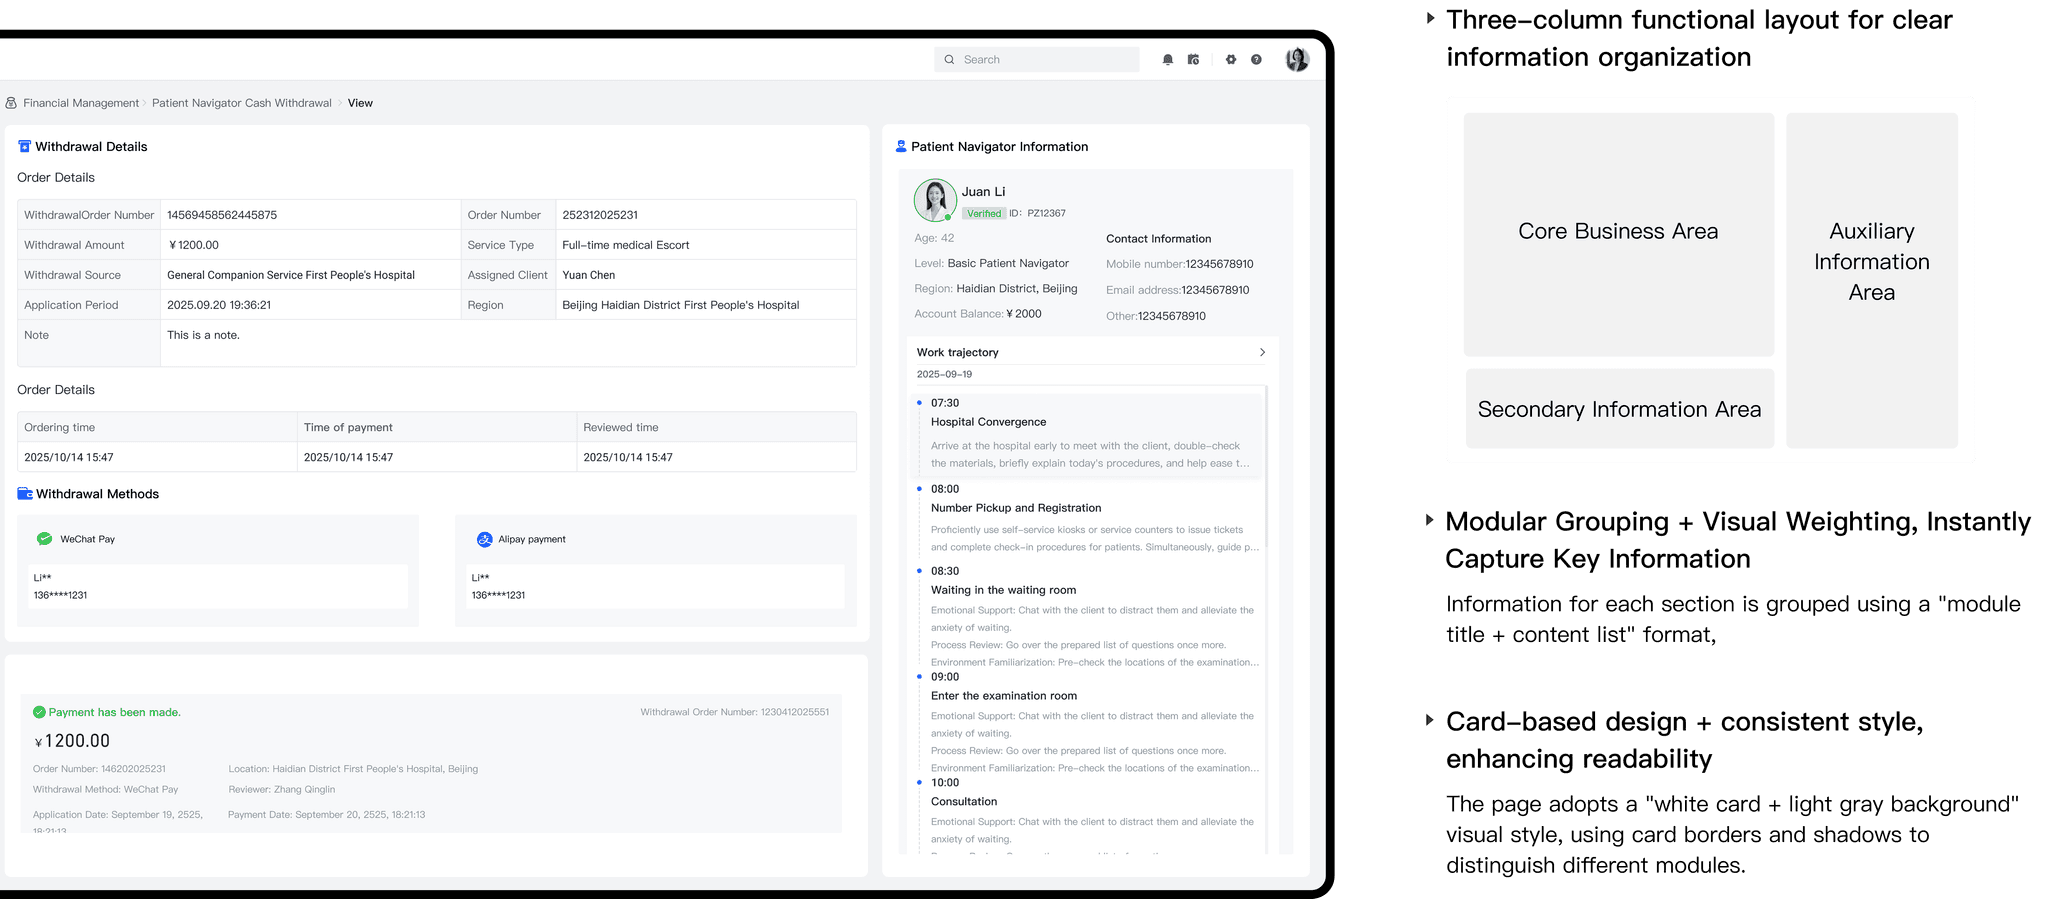
A standard three-column layout
- Three columns: a core business area, a secondary information area and an auxiliary information area.
- Modular grouping and visual weighting: each section uses a “module title + content list” format, so key information is caught at a glance.
- White cards on a light gray background, with borders and shadows separating modules.
Forms
Clear structure for quick data entry
Streamlined paths, smart prompts and responsive feedback reduce the effort of each task.
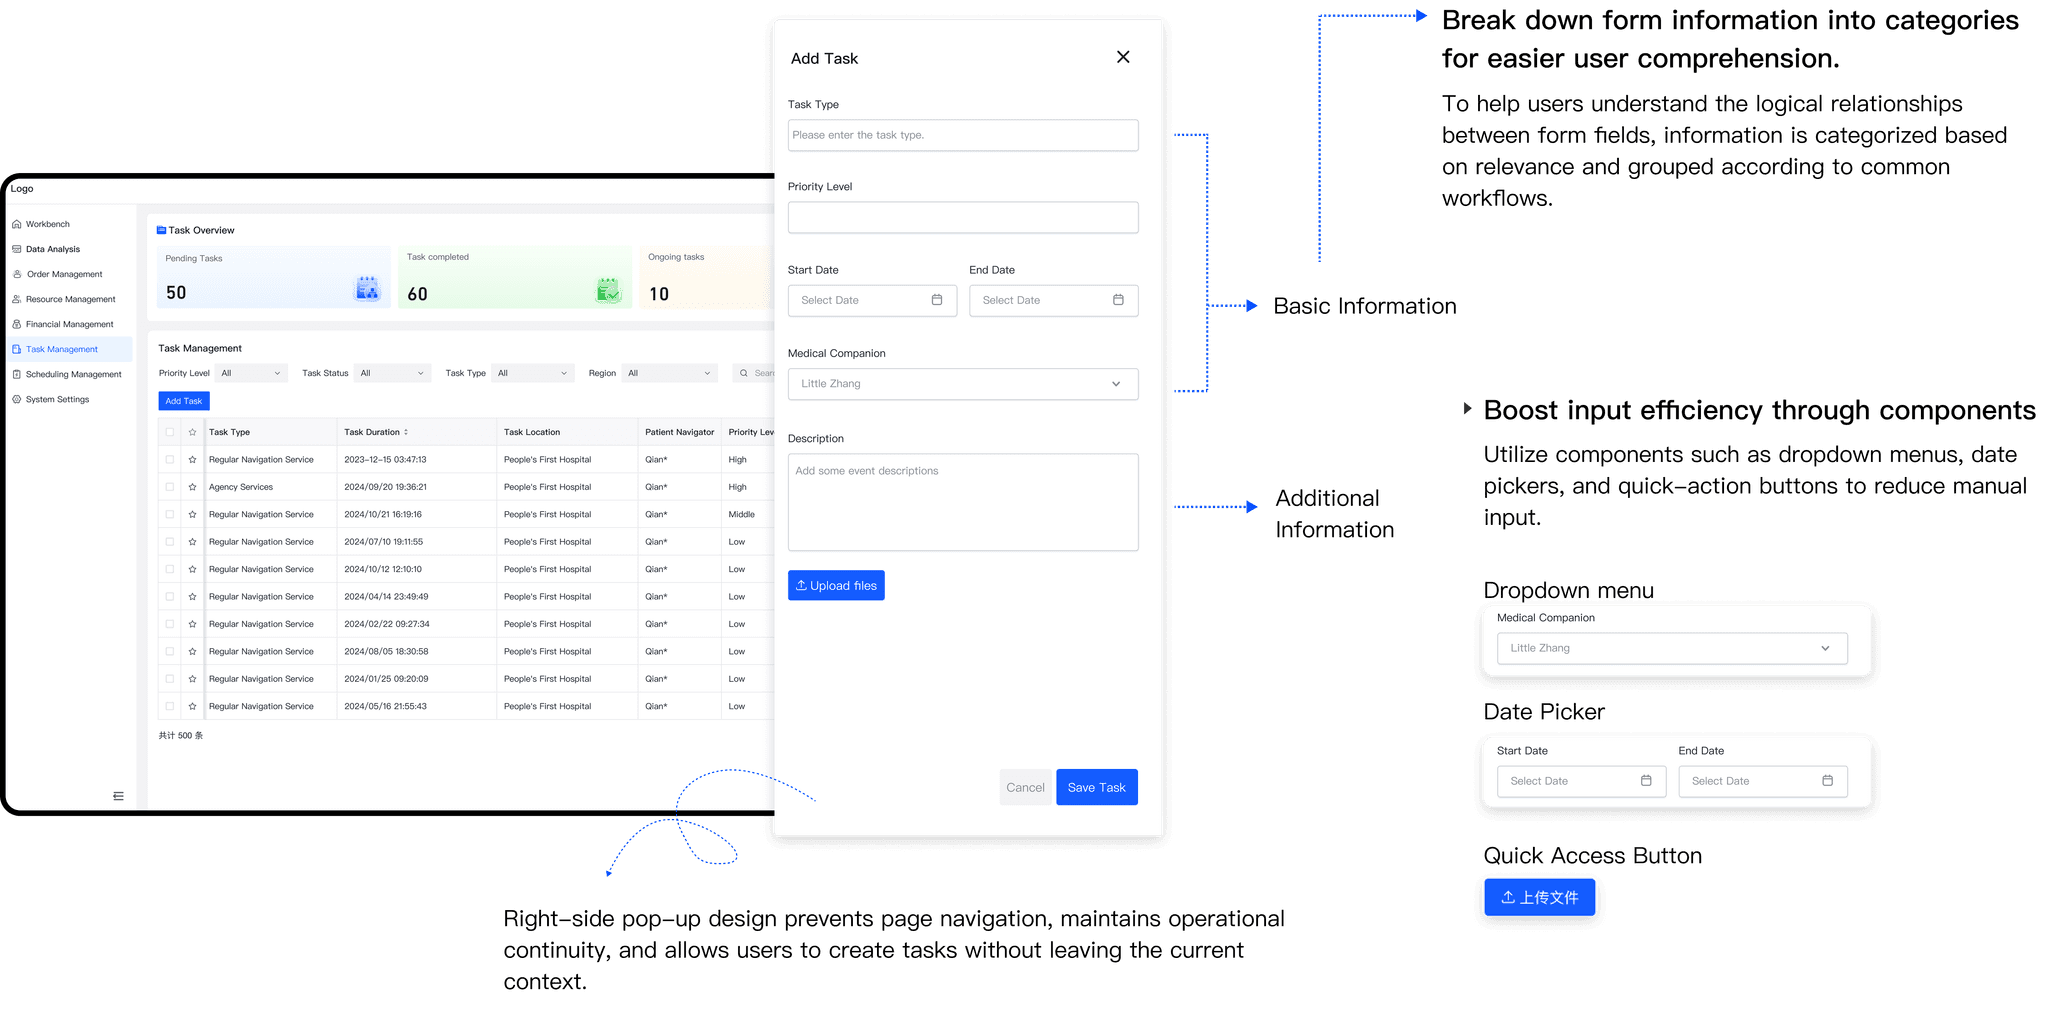
- Fields grouped by category, based on relevance and common workflows, so the logic of the form is easy to follow.
- Components speed up input: dropdown menus, date pickers and quick-action buttons replace manual typing.
- A side pop-up keeps page navigation continuous: users create tasks without leaving the current content.
Scheduling
Fewer steps through operation buttons
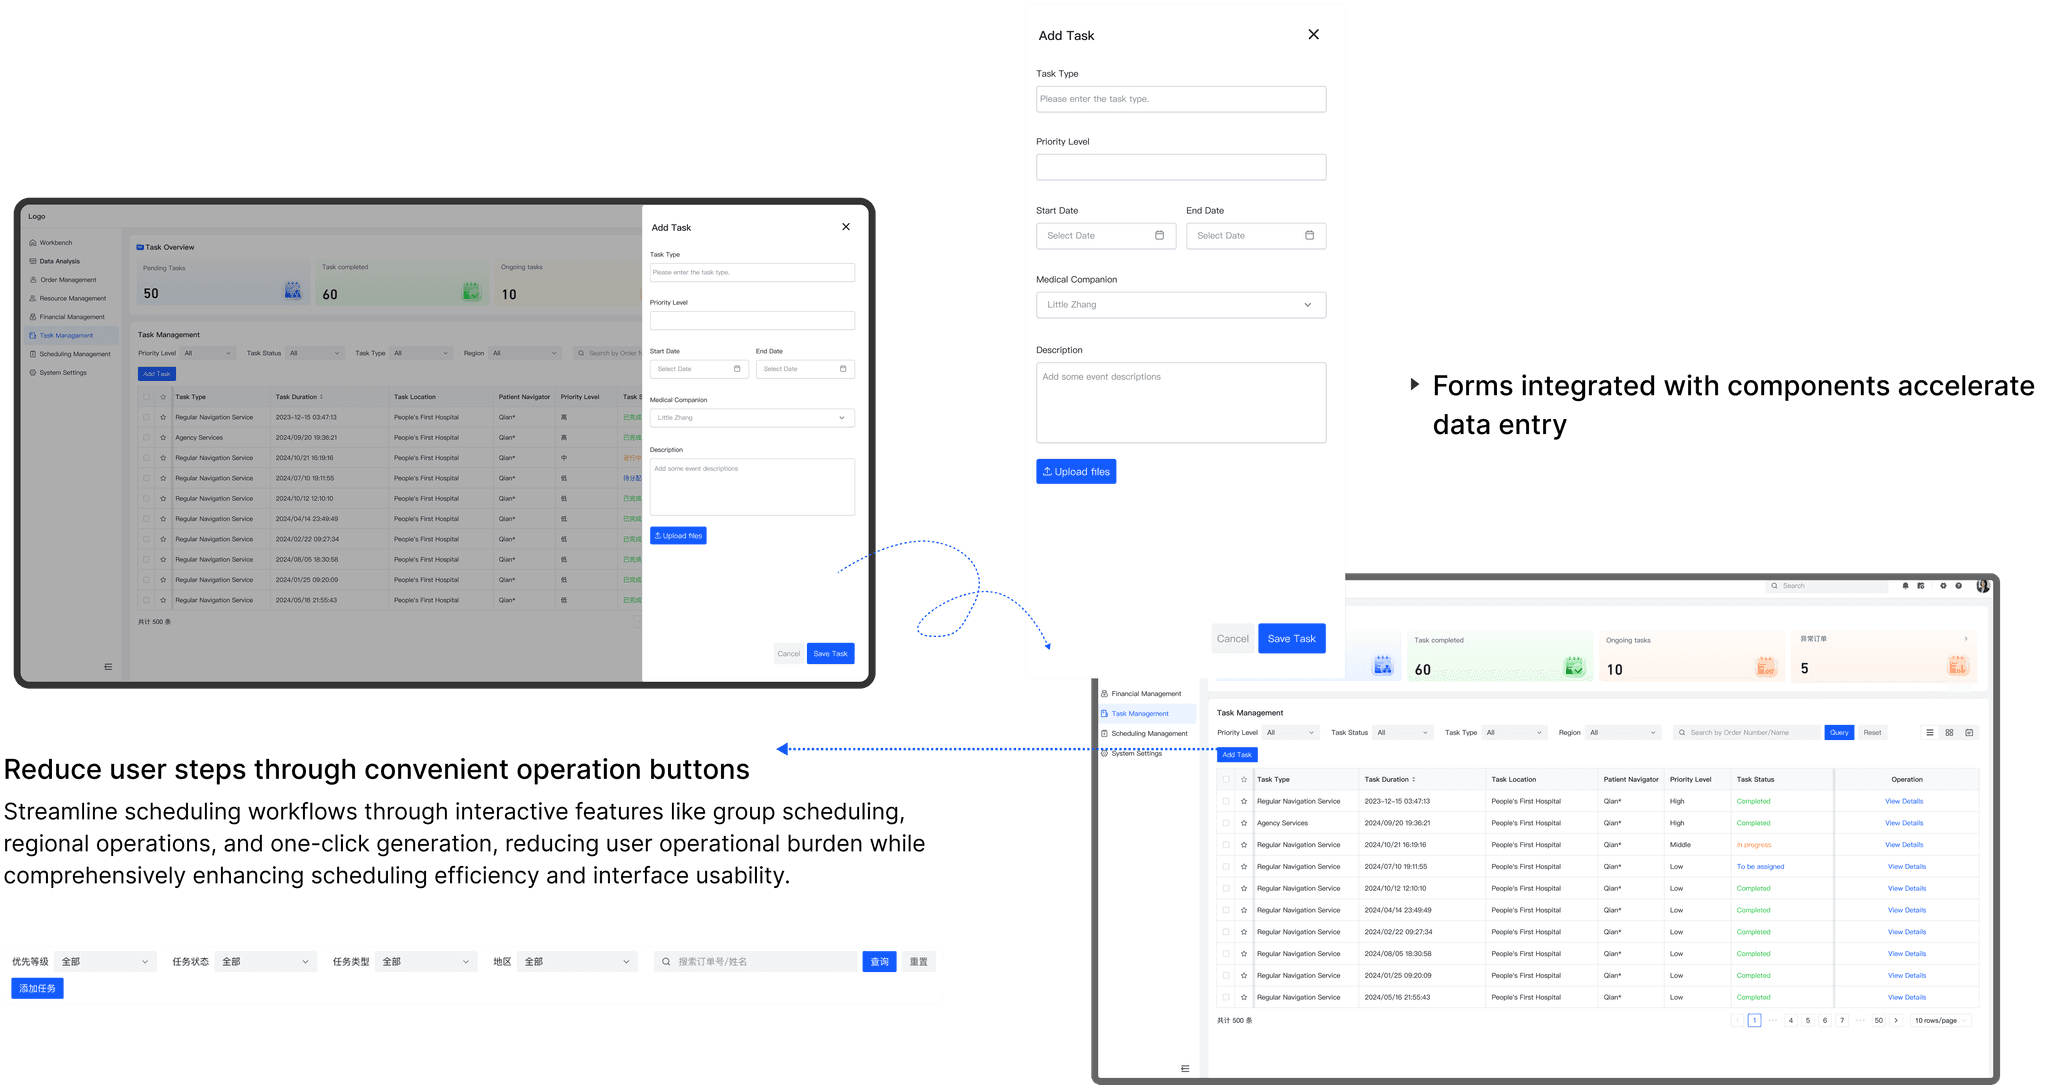
Contextual interaction design keeps the interface logic aligned with how staff actually work.
- Group scheduling, regional operations and one-click generation cut the operational burden of building schedules.
- Forms built from components make data entry faster.
Task views
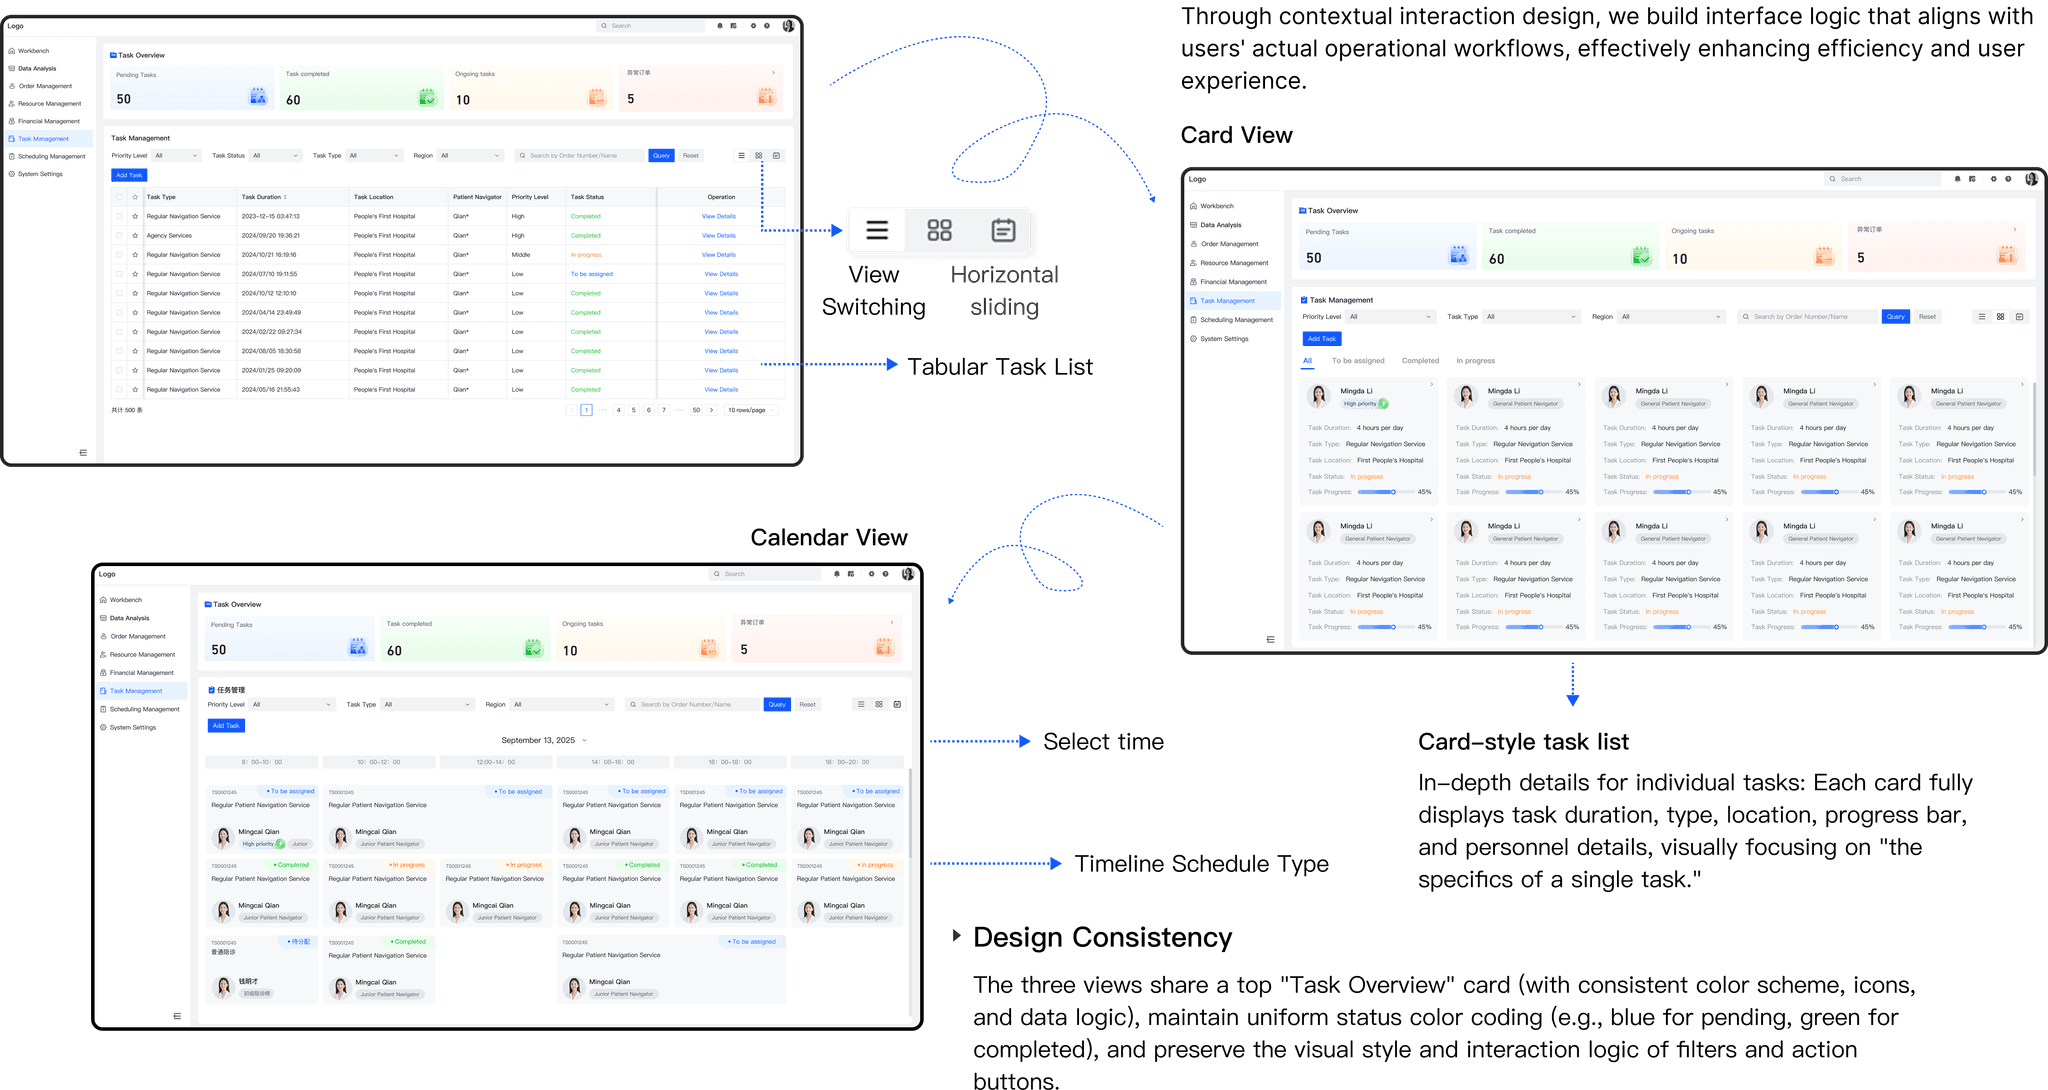
Context-aware views for one task list
- Three views: a tabular task list, a card view with each task’s duration, type, location, progress and staff, and a calendar view by time.
- Design consistency. All three share a top “Task Overview” card, the same status colors (blue pending, green completed), and the same filters and actions.
Task cards
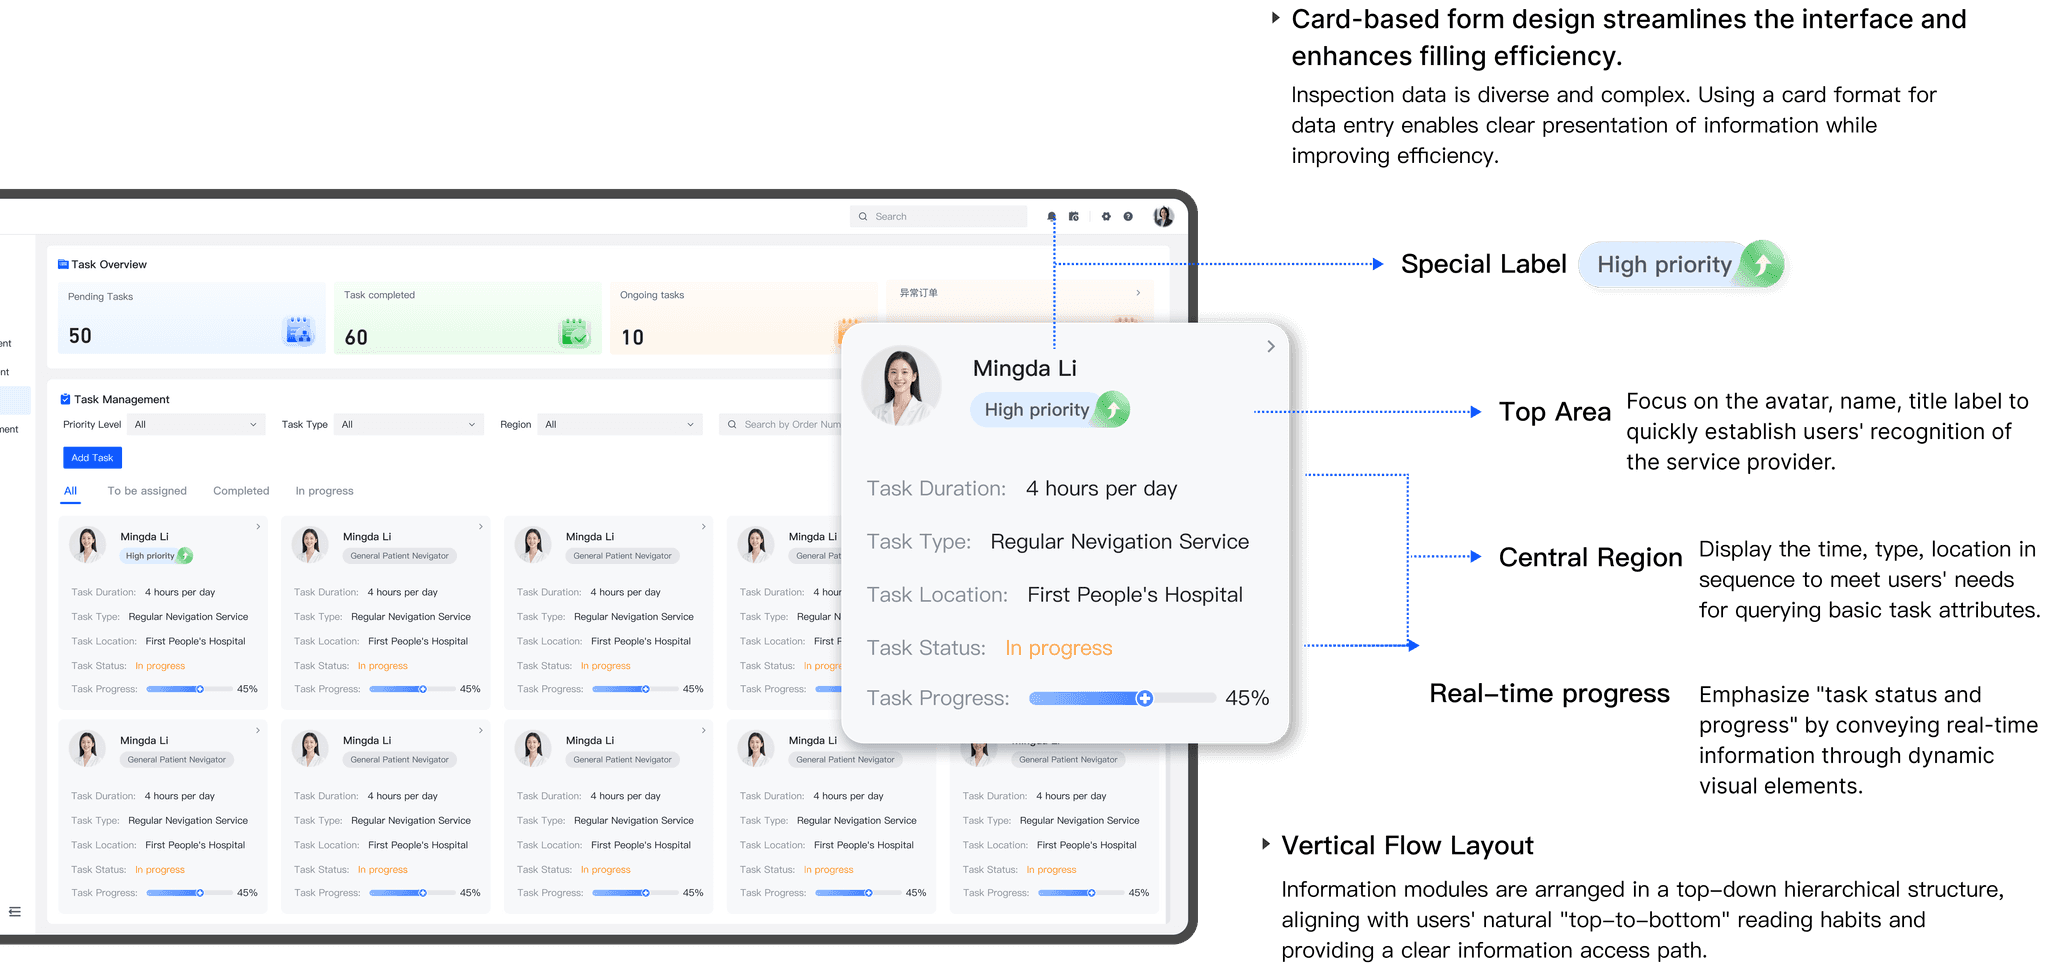
Card-based form design for complex inspection data
- Top area: avatar, name and title label, so the service provider is recognized quickly; a special label marks priority.
- Central region: time, type and location, in the order users look for them.
- Real-time progress shows task status through a dynamic visual element.
- Vertical flow: modules read top to bottom, a clear path through the information.
Tables
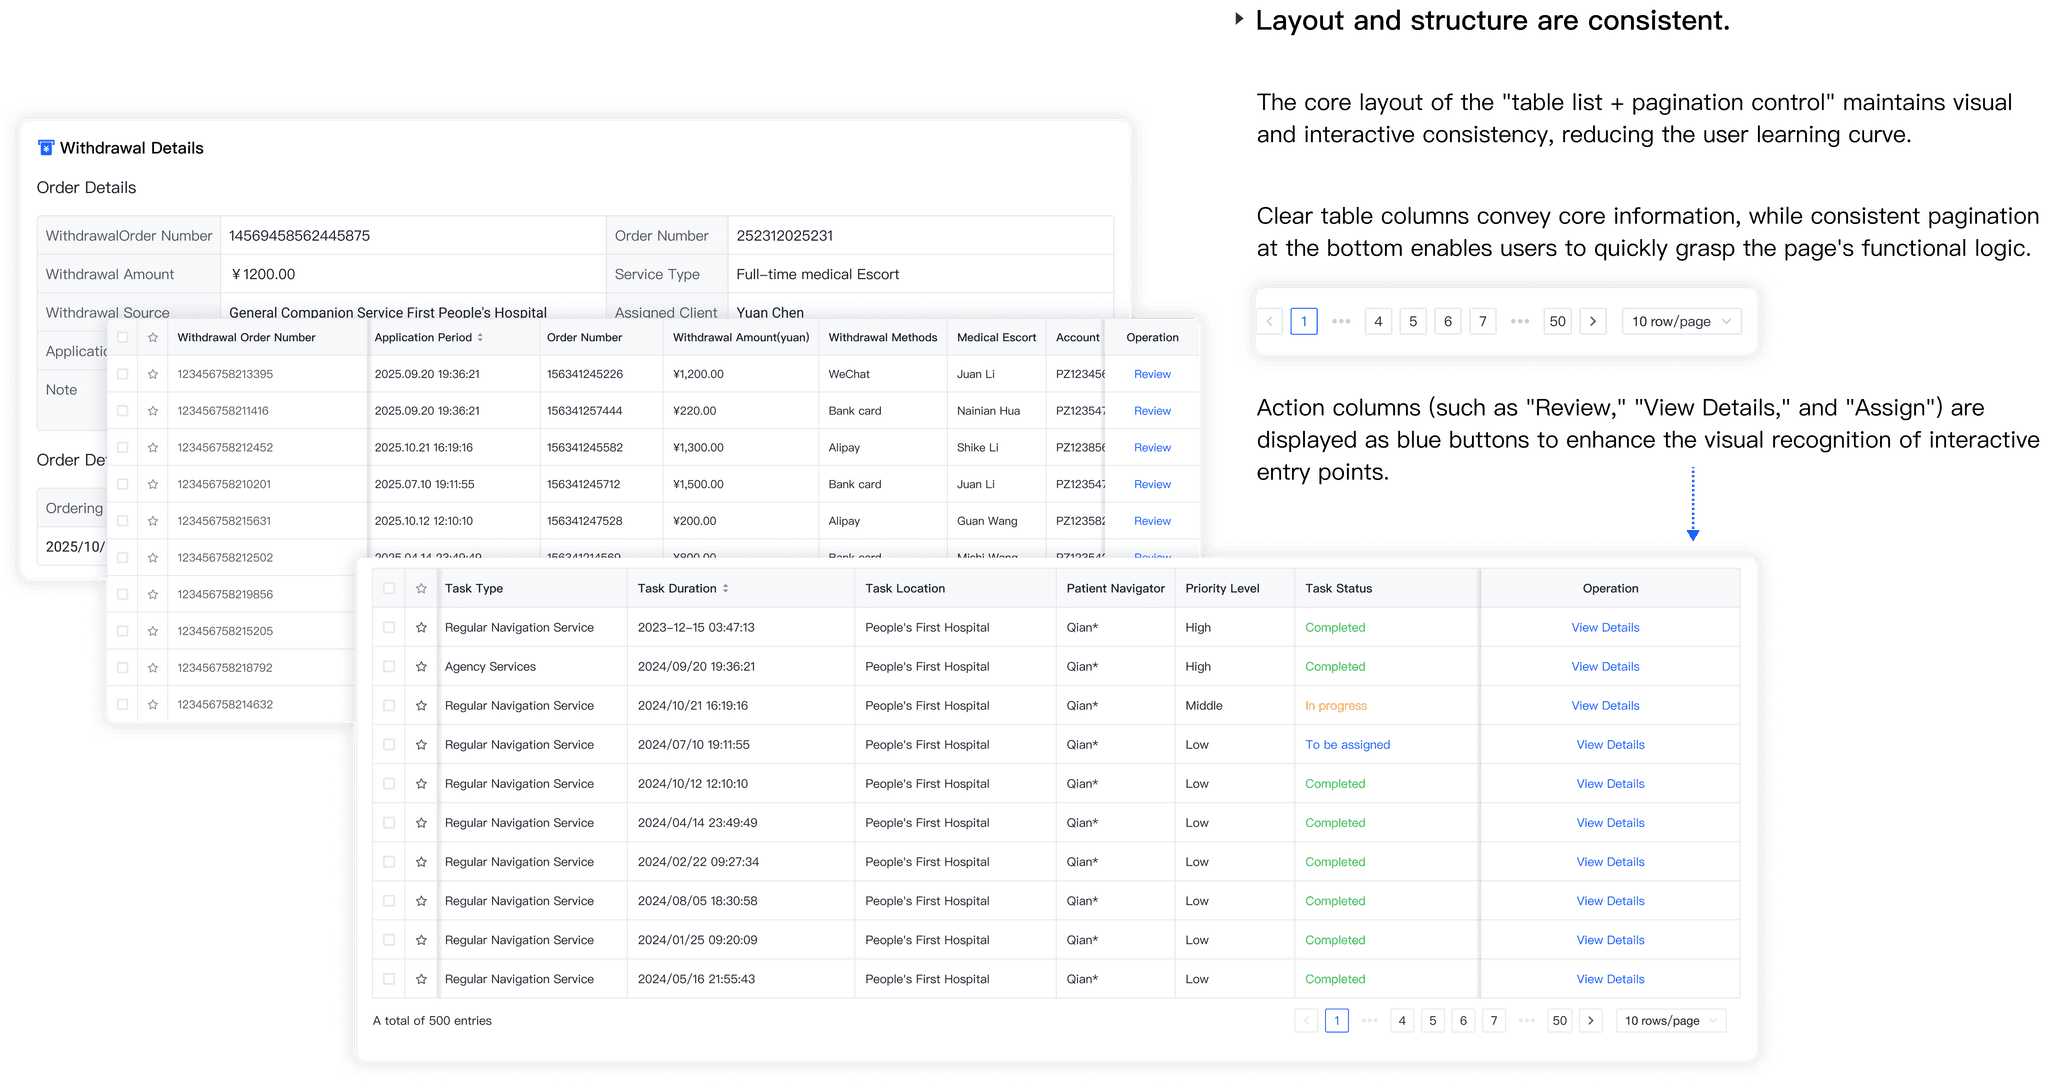
Streamlined structure for complex data tables
- One consistent layout, “table list + pagination”, lowers the learning curve.
- Clear columns carry the core information; pagination stays at the bottom.
- Action columns (Review, View Details, Assign) are blue buttons, so entry points stand out.
Mobile app
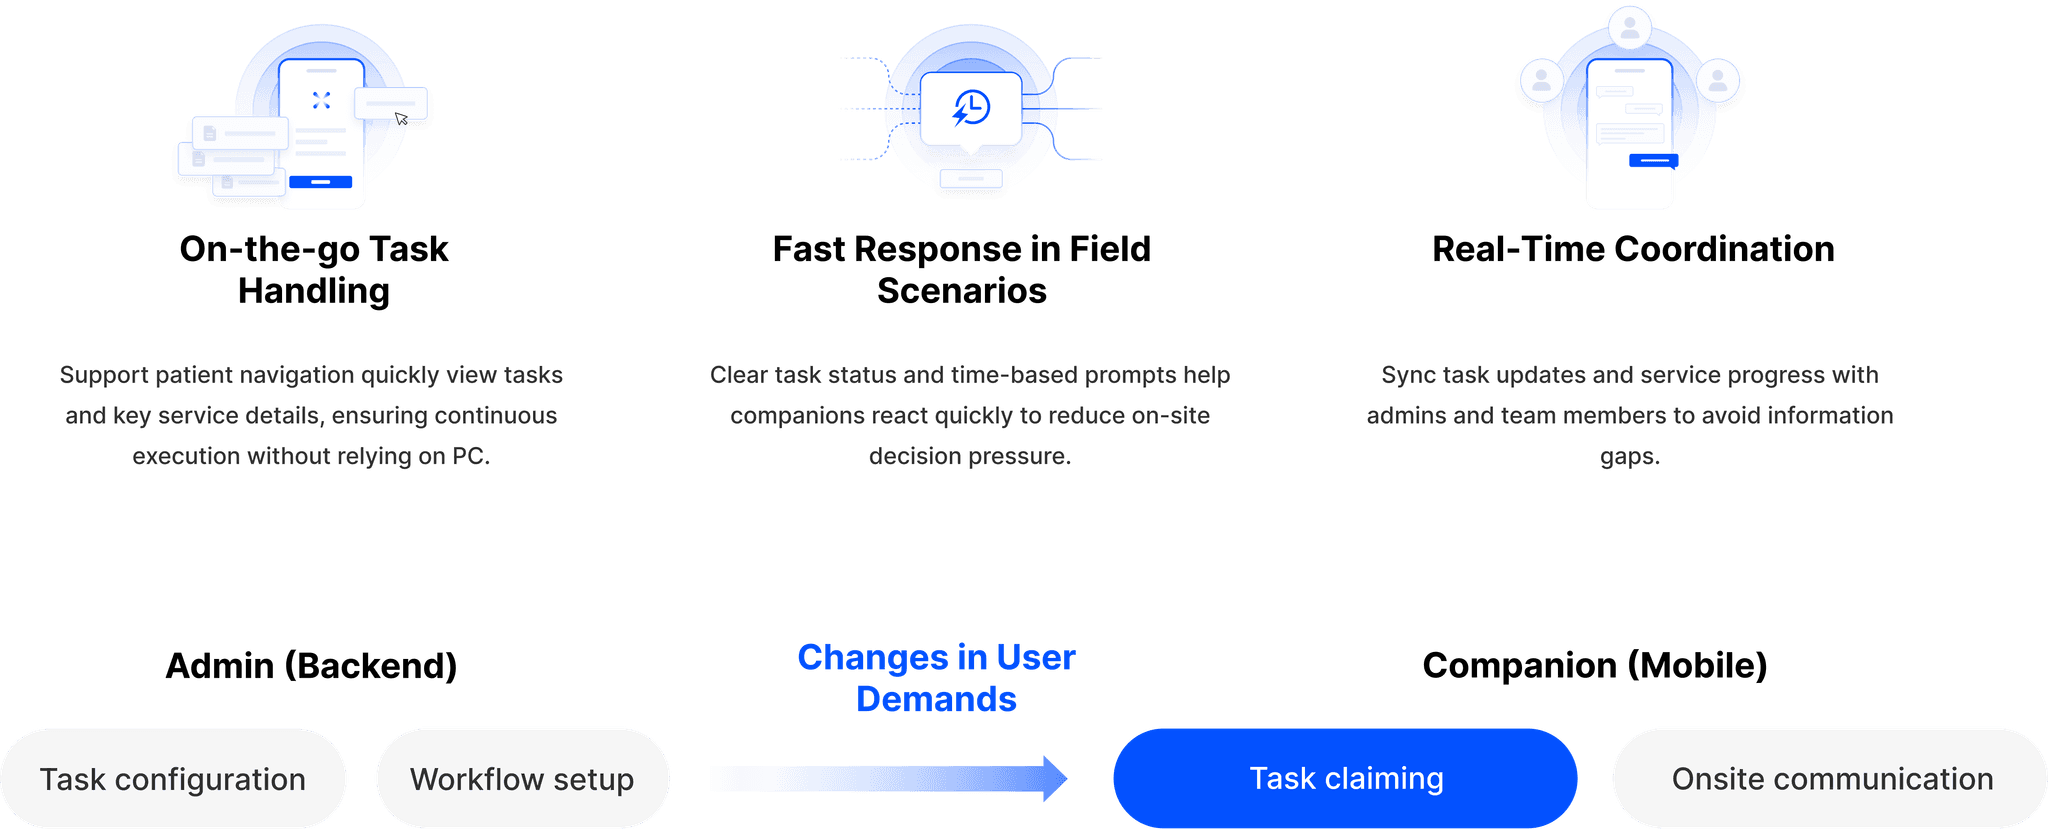
Gave navigators a companion app for handling tasks on the move.
The navigator app connects to the same system: admins configure tasks and workflows, navigators claim them and communicate on site. It covers on-the-go task handling, fast response in field scenarios, and real-time coordination with admins and team members.
Functional architecture
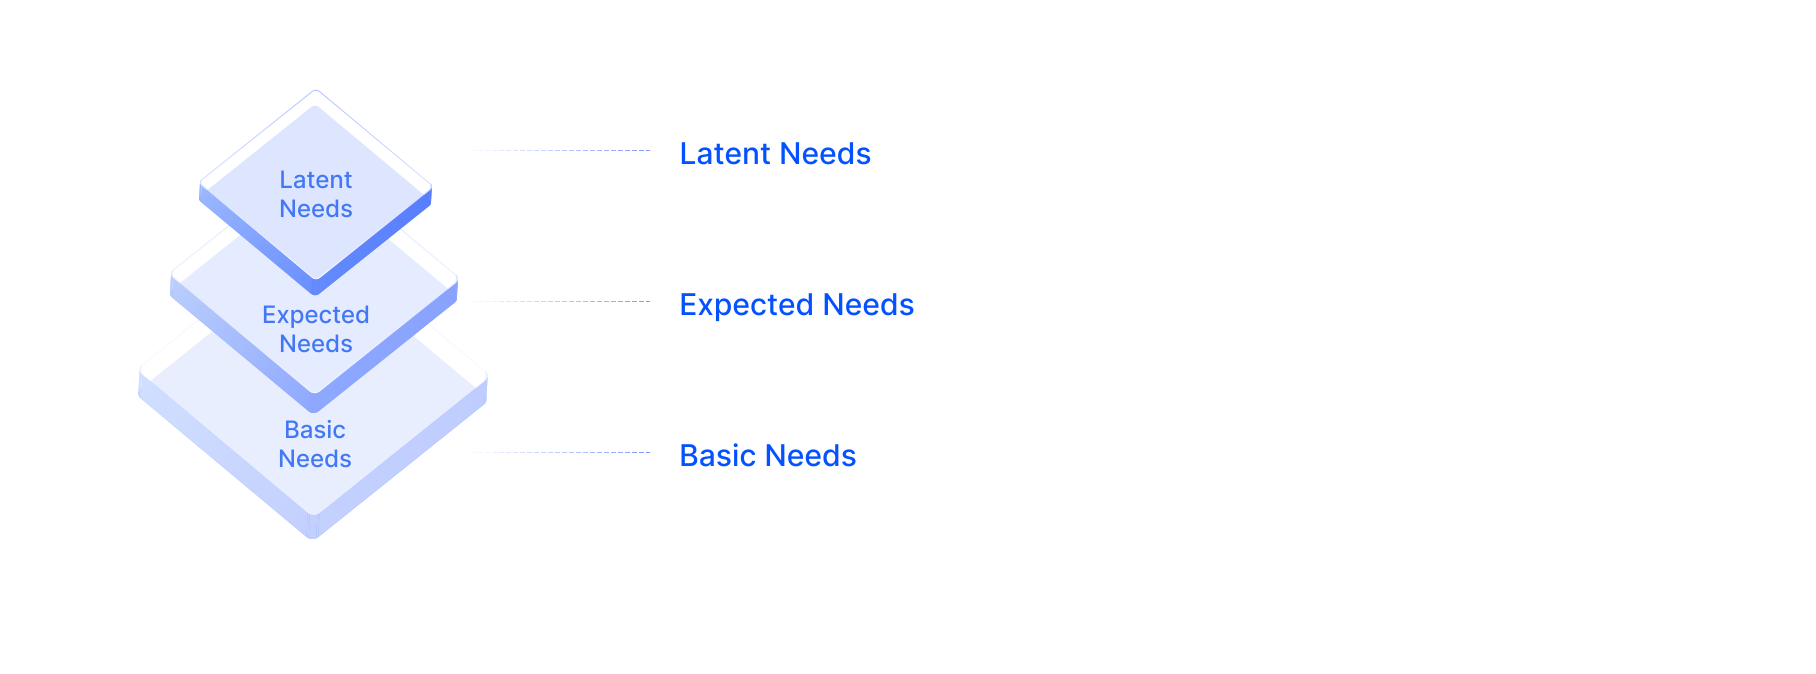
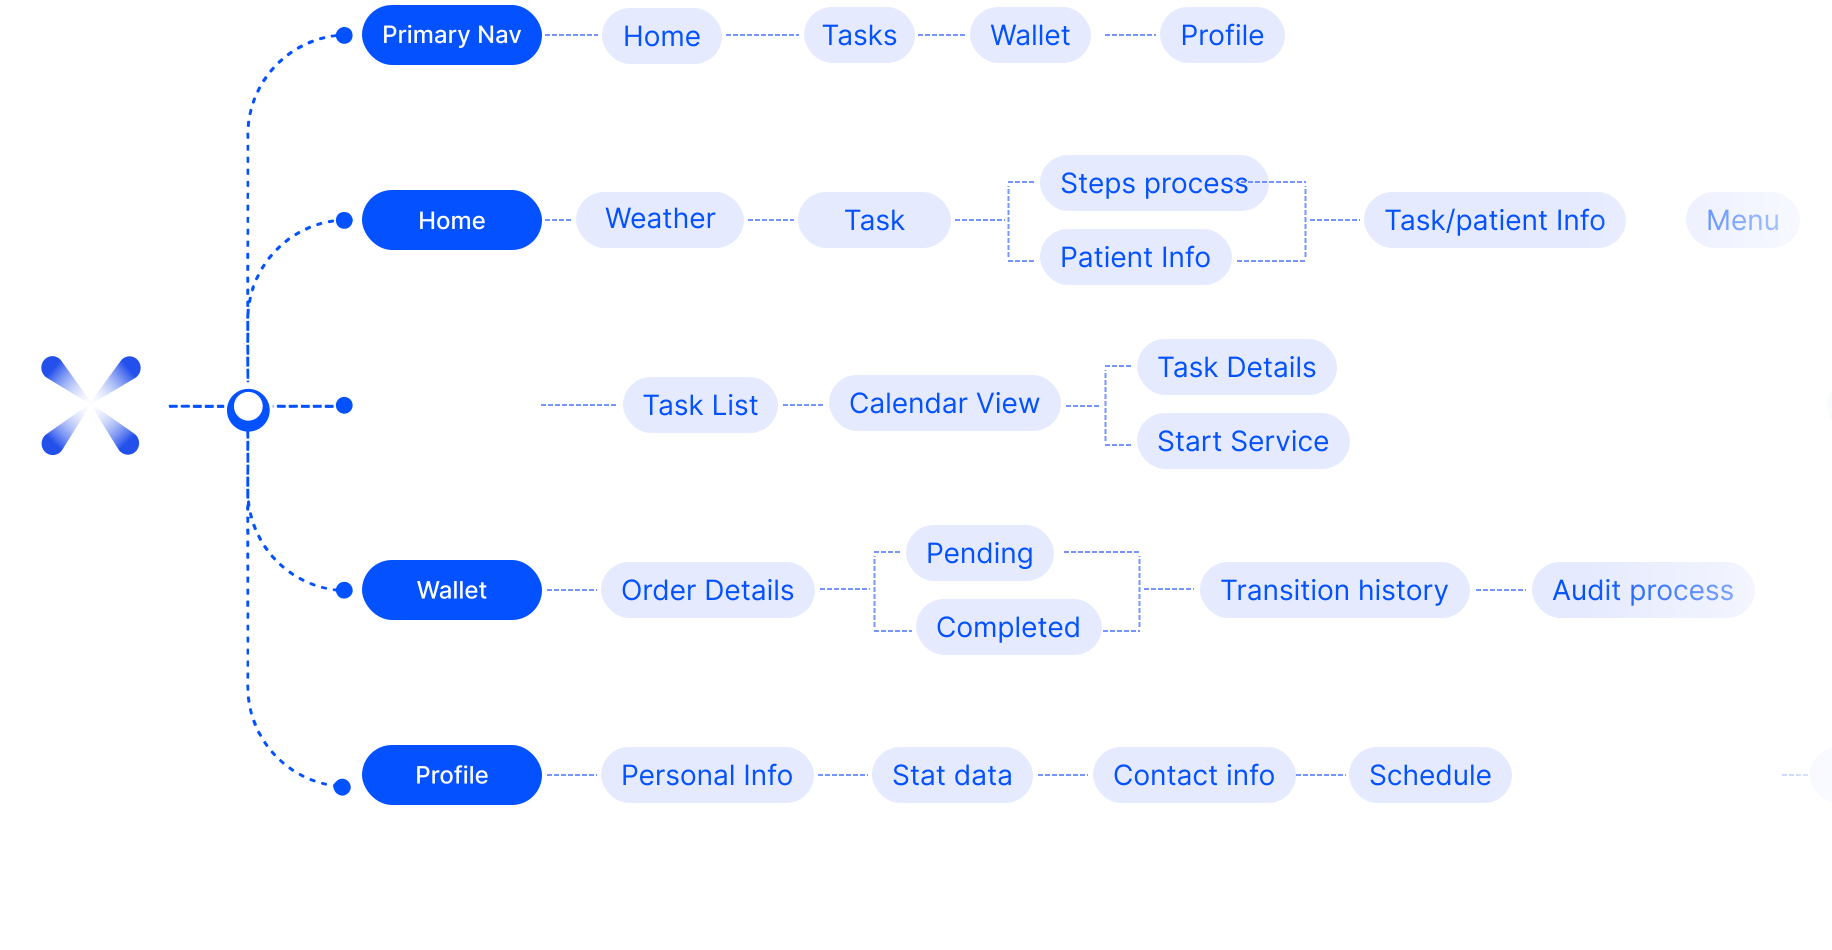
Features are layered from basic to expected to latent needs, under four primary tabs: Home, Tasks, Wallet and Profile.
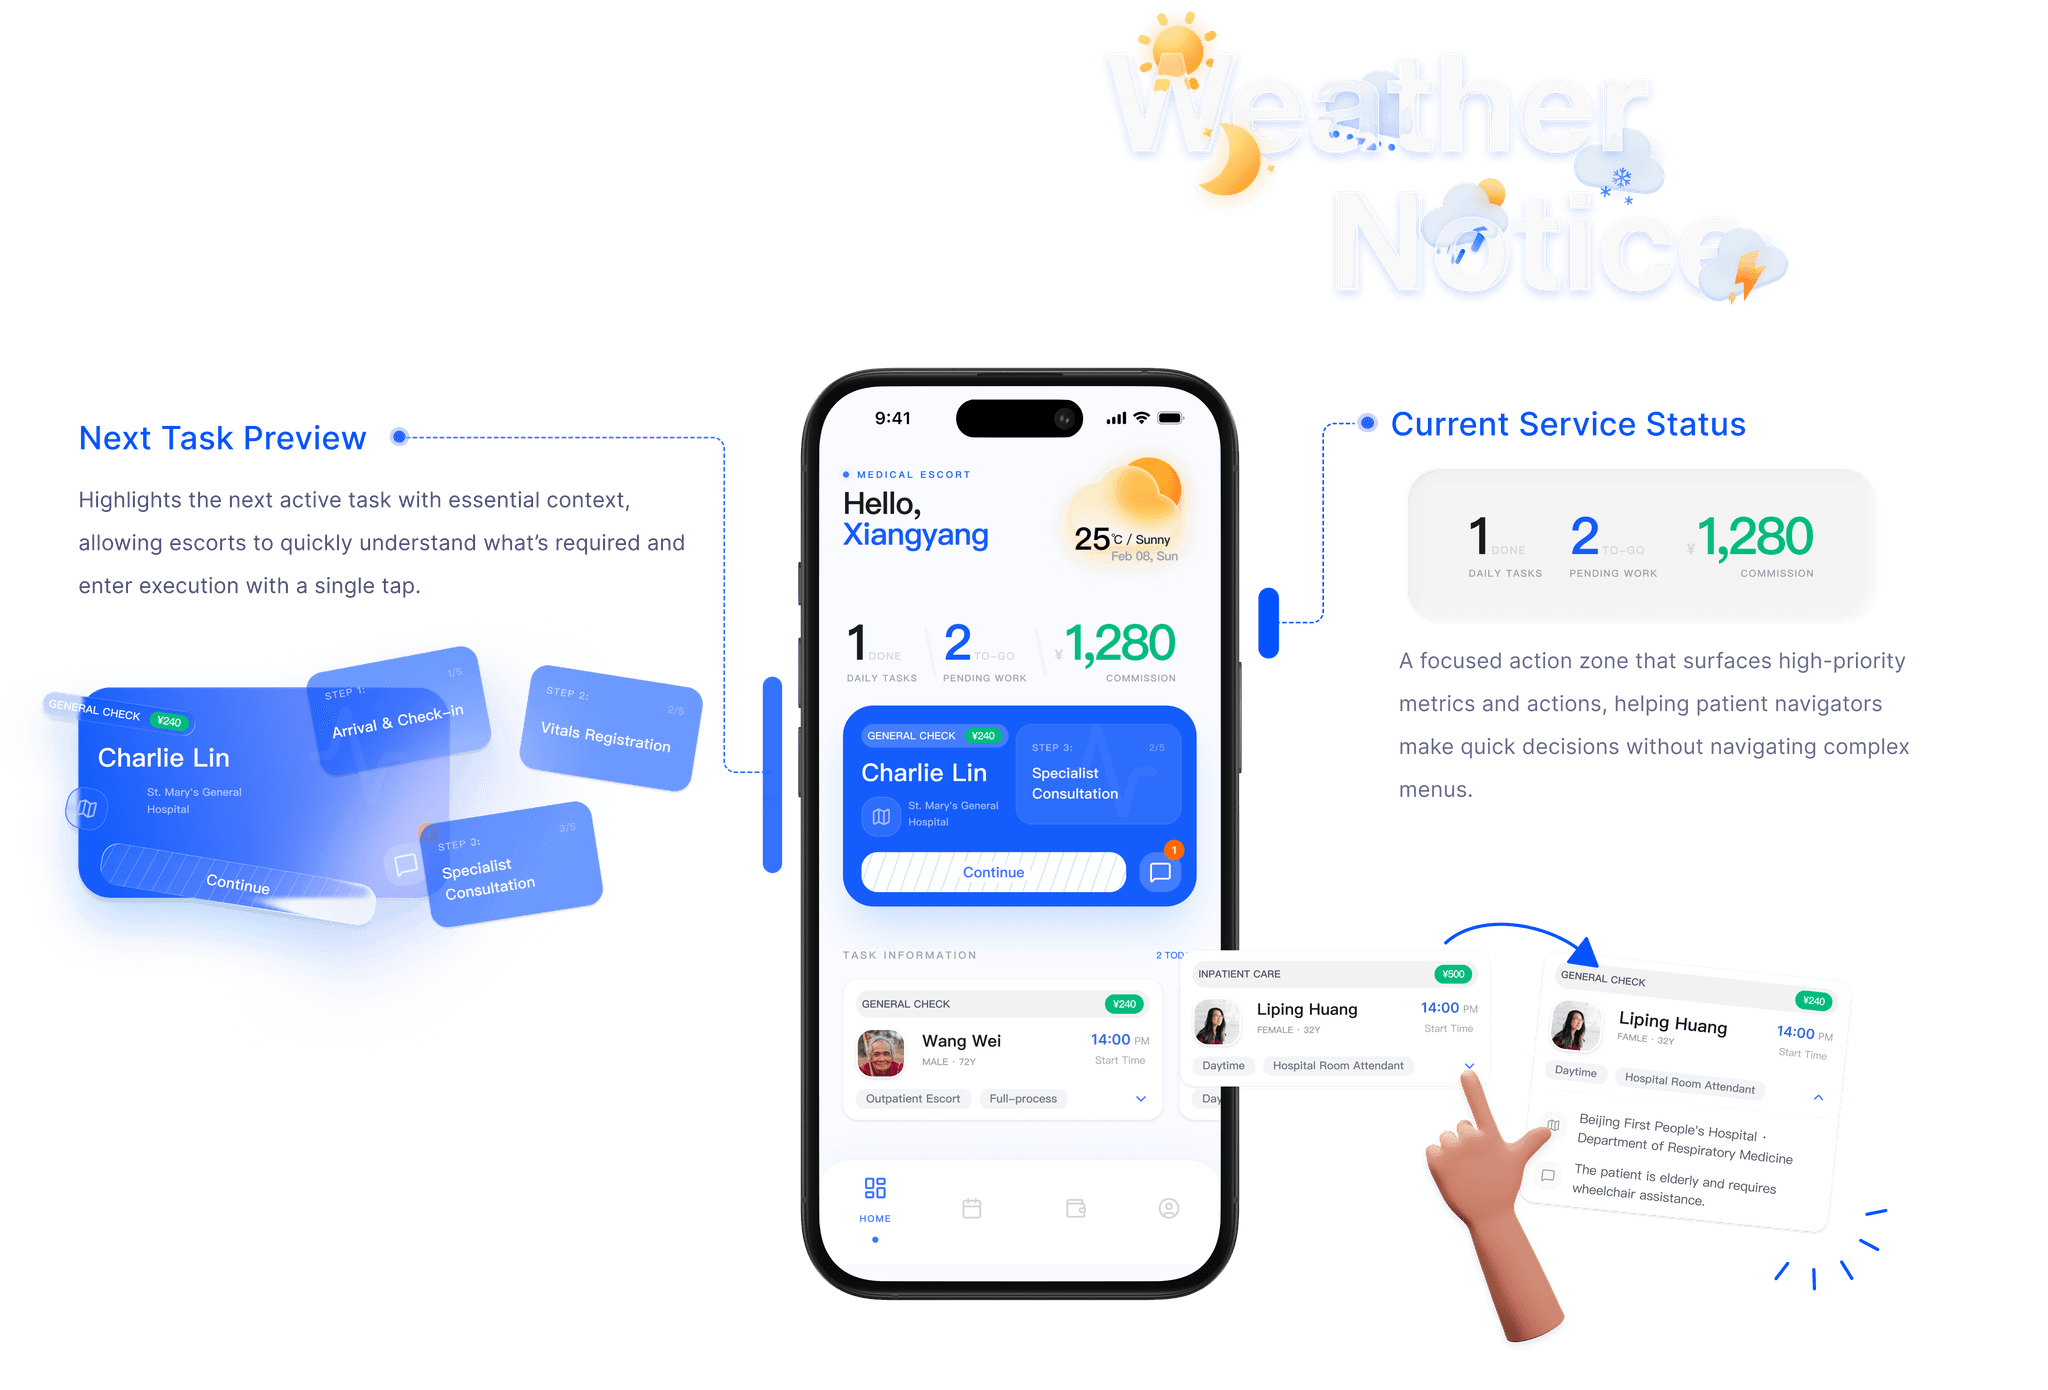
Stay oriented. Stay in control.
Clear task states, upcoming actions and time-based guidance help navigators stay focused and confident during on-site hospital services.
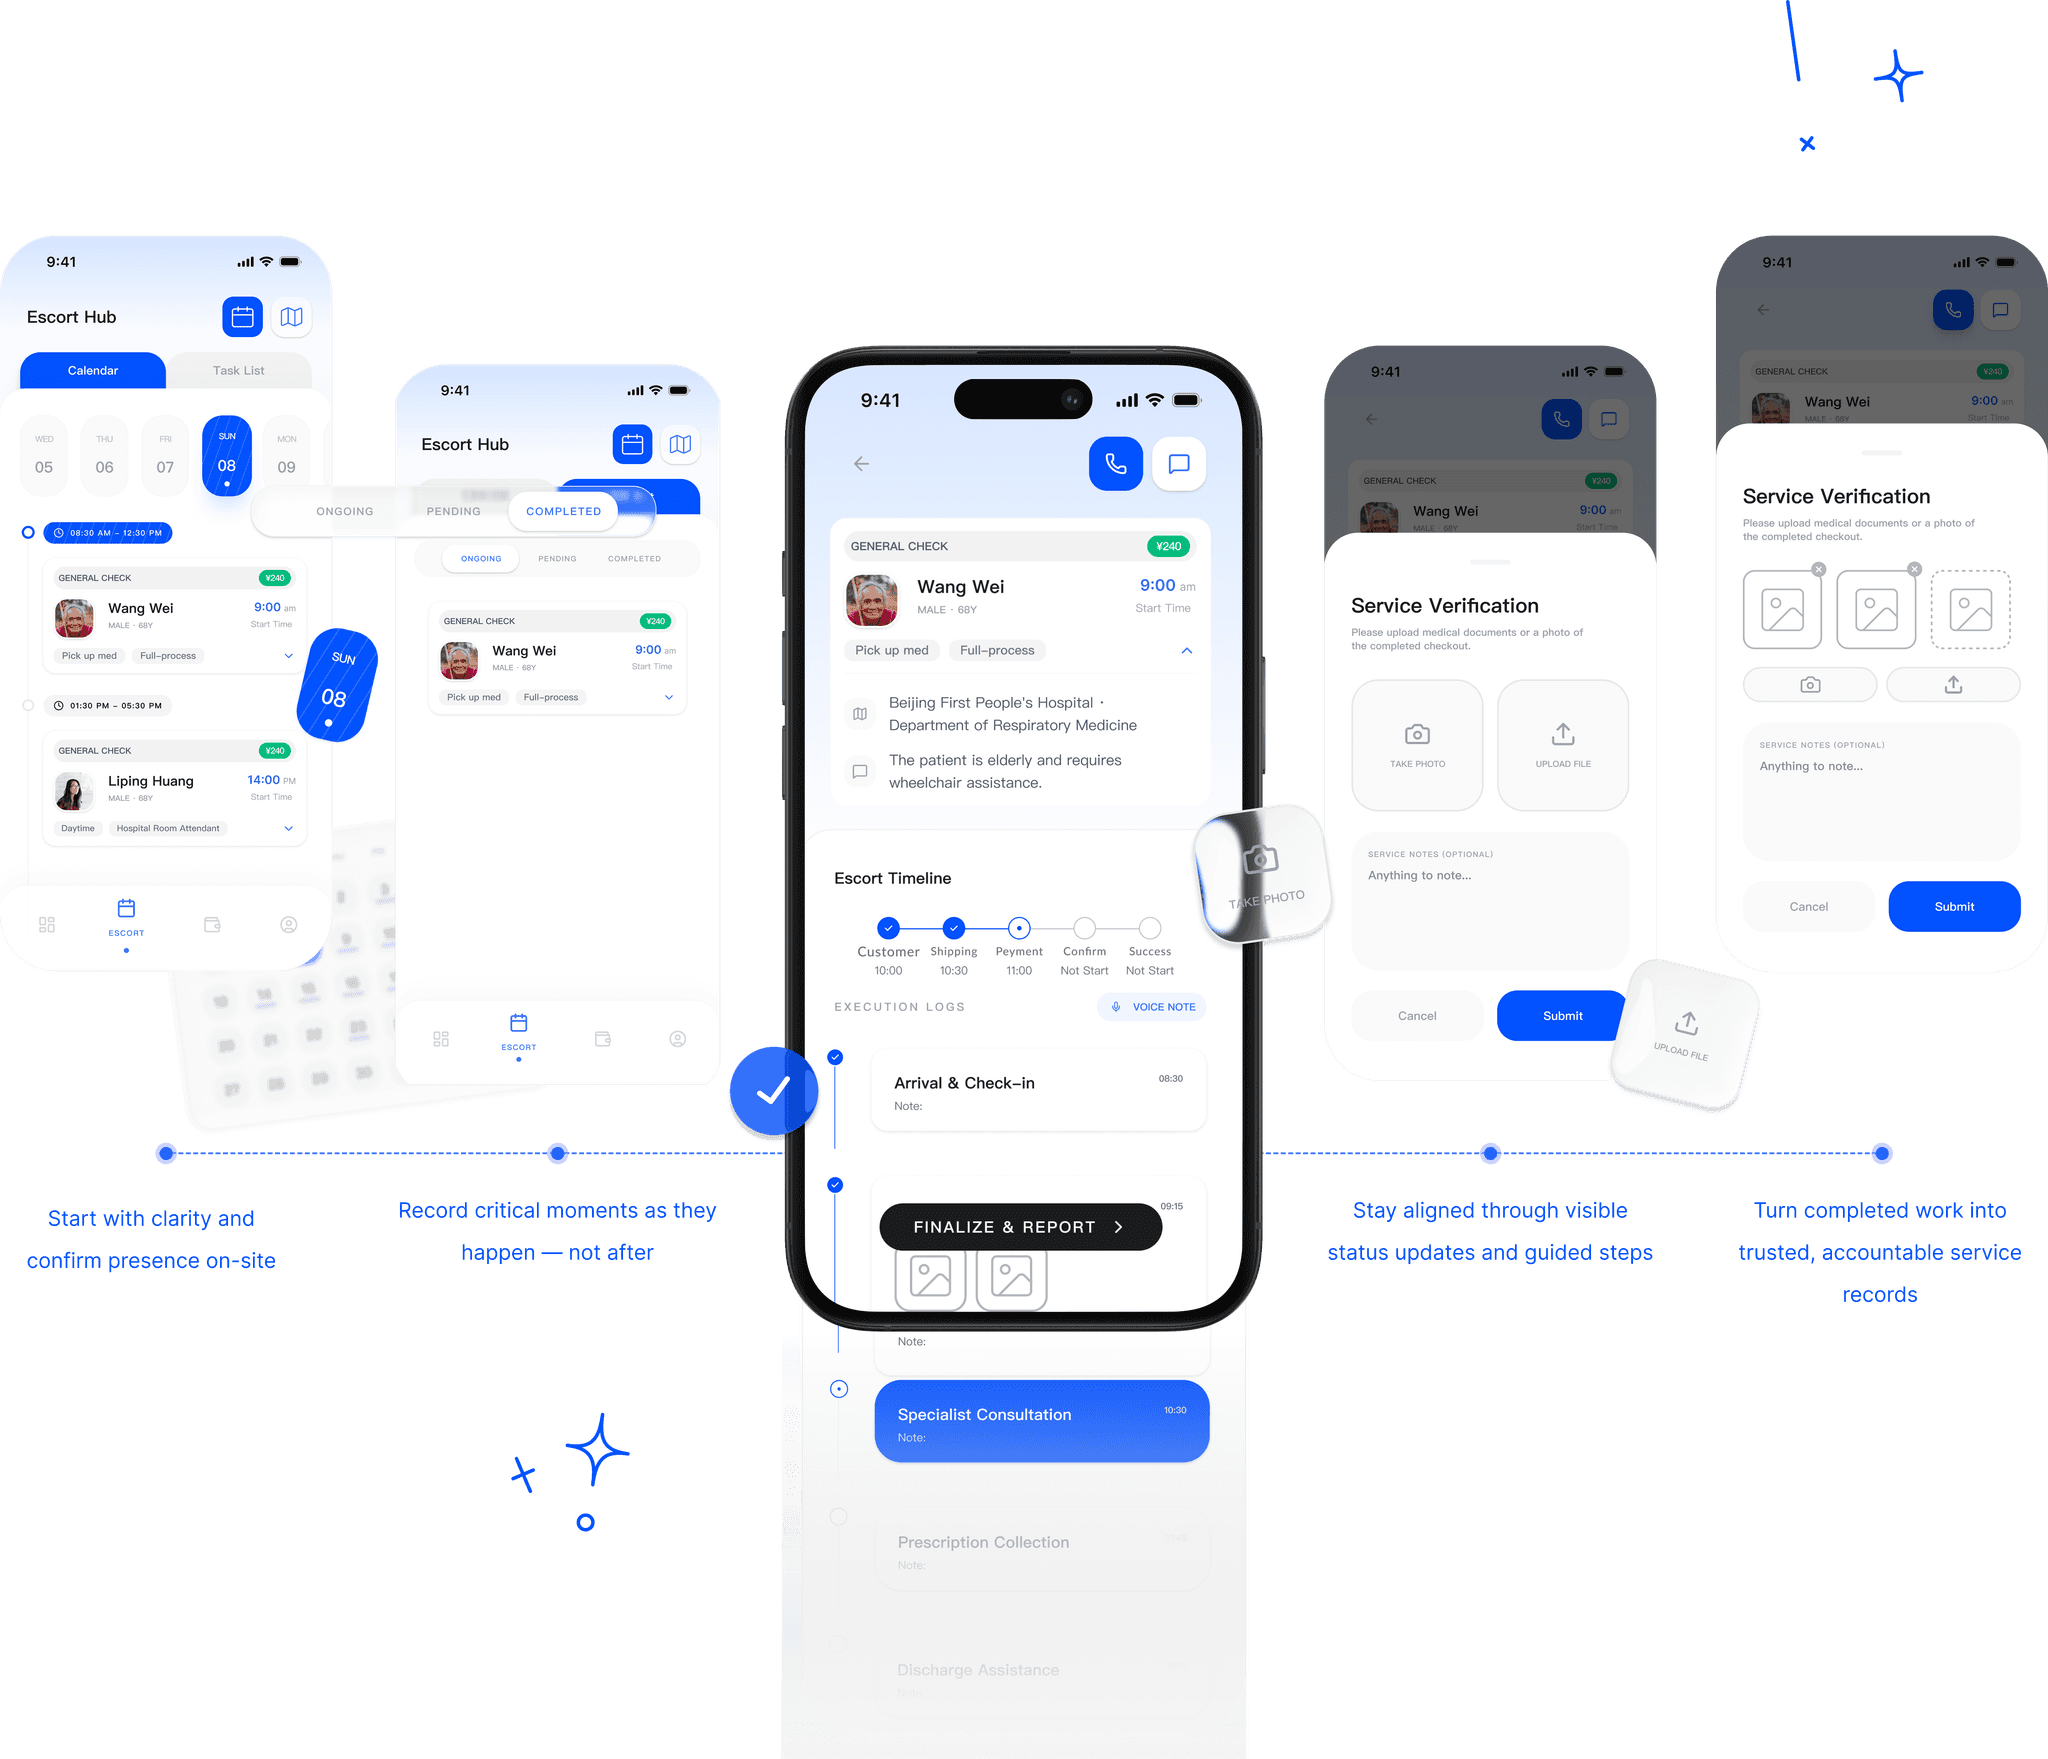
From arrival to report
A structured timeline guides navigators through each stage of care, reducing uncertainty, clarifying responsibilities and making sure every service is completed.
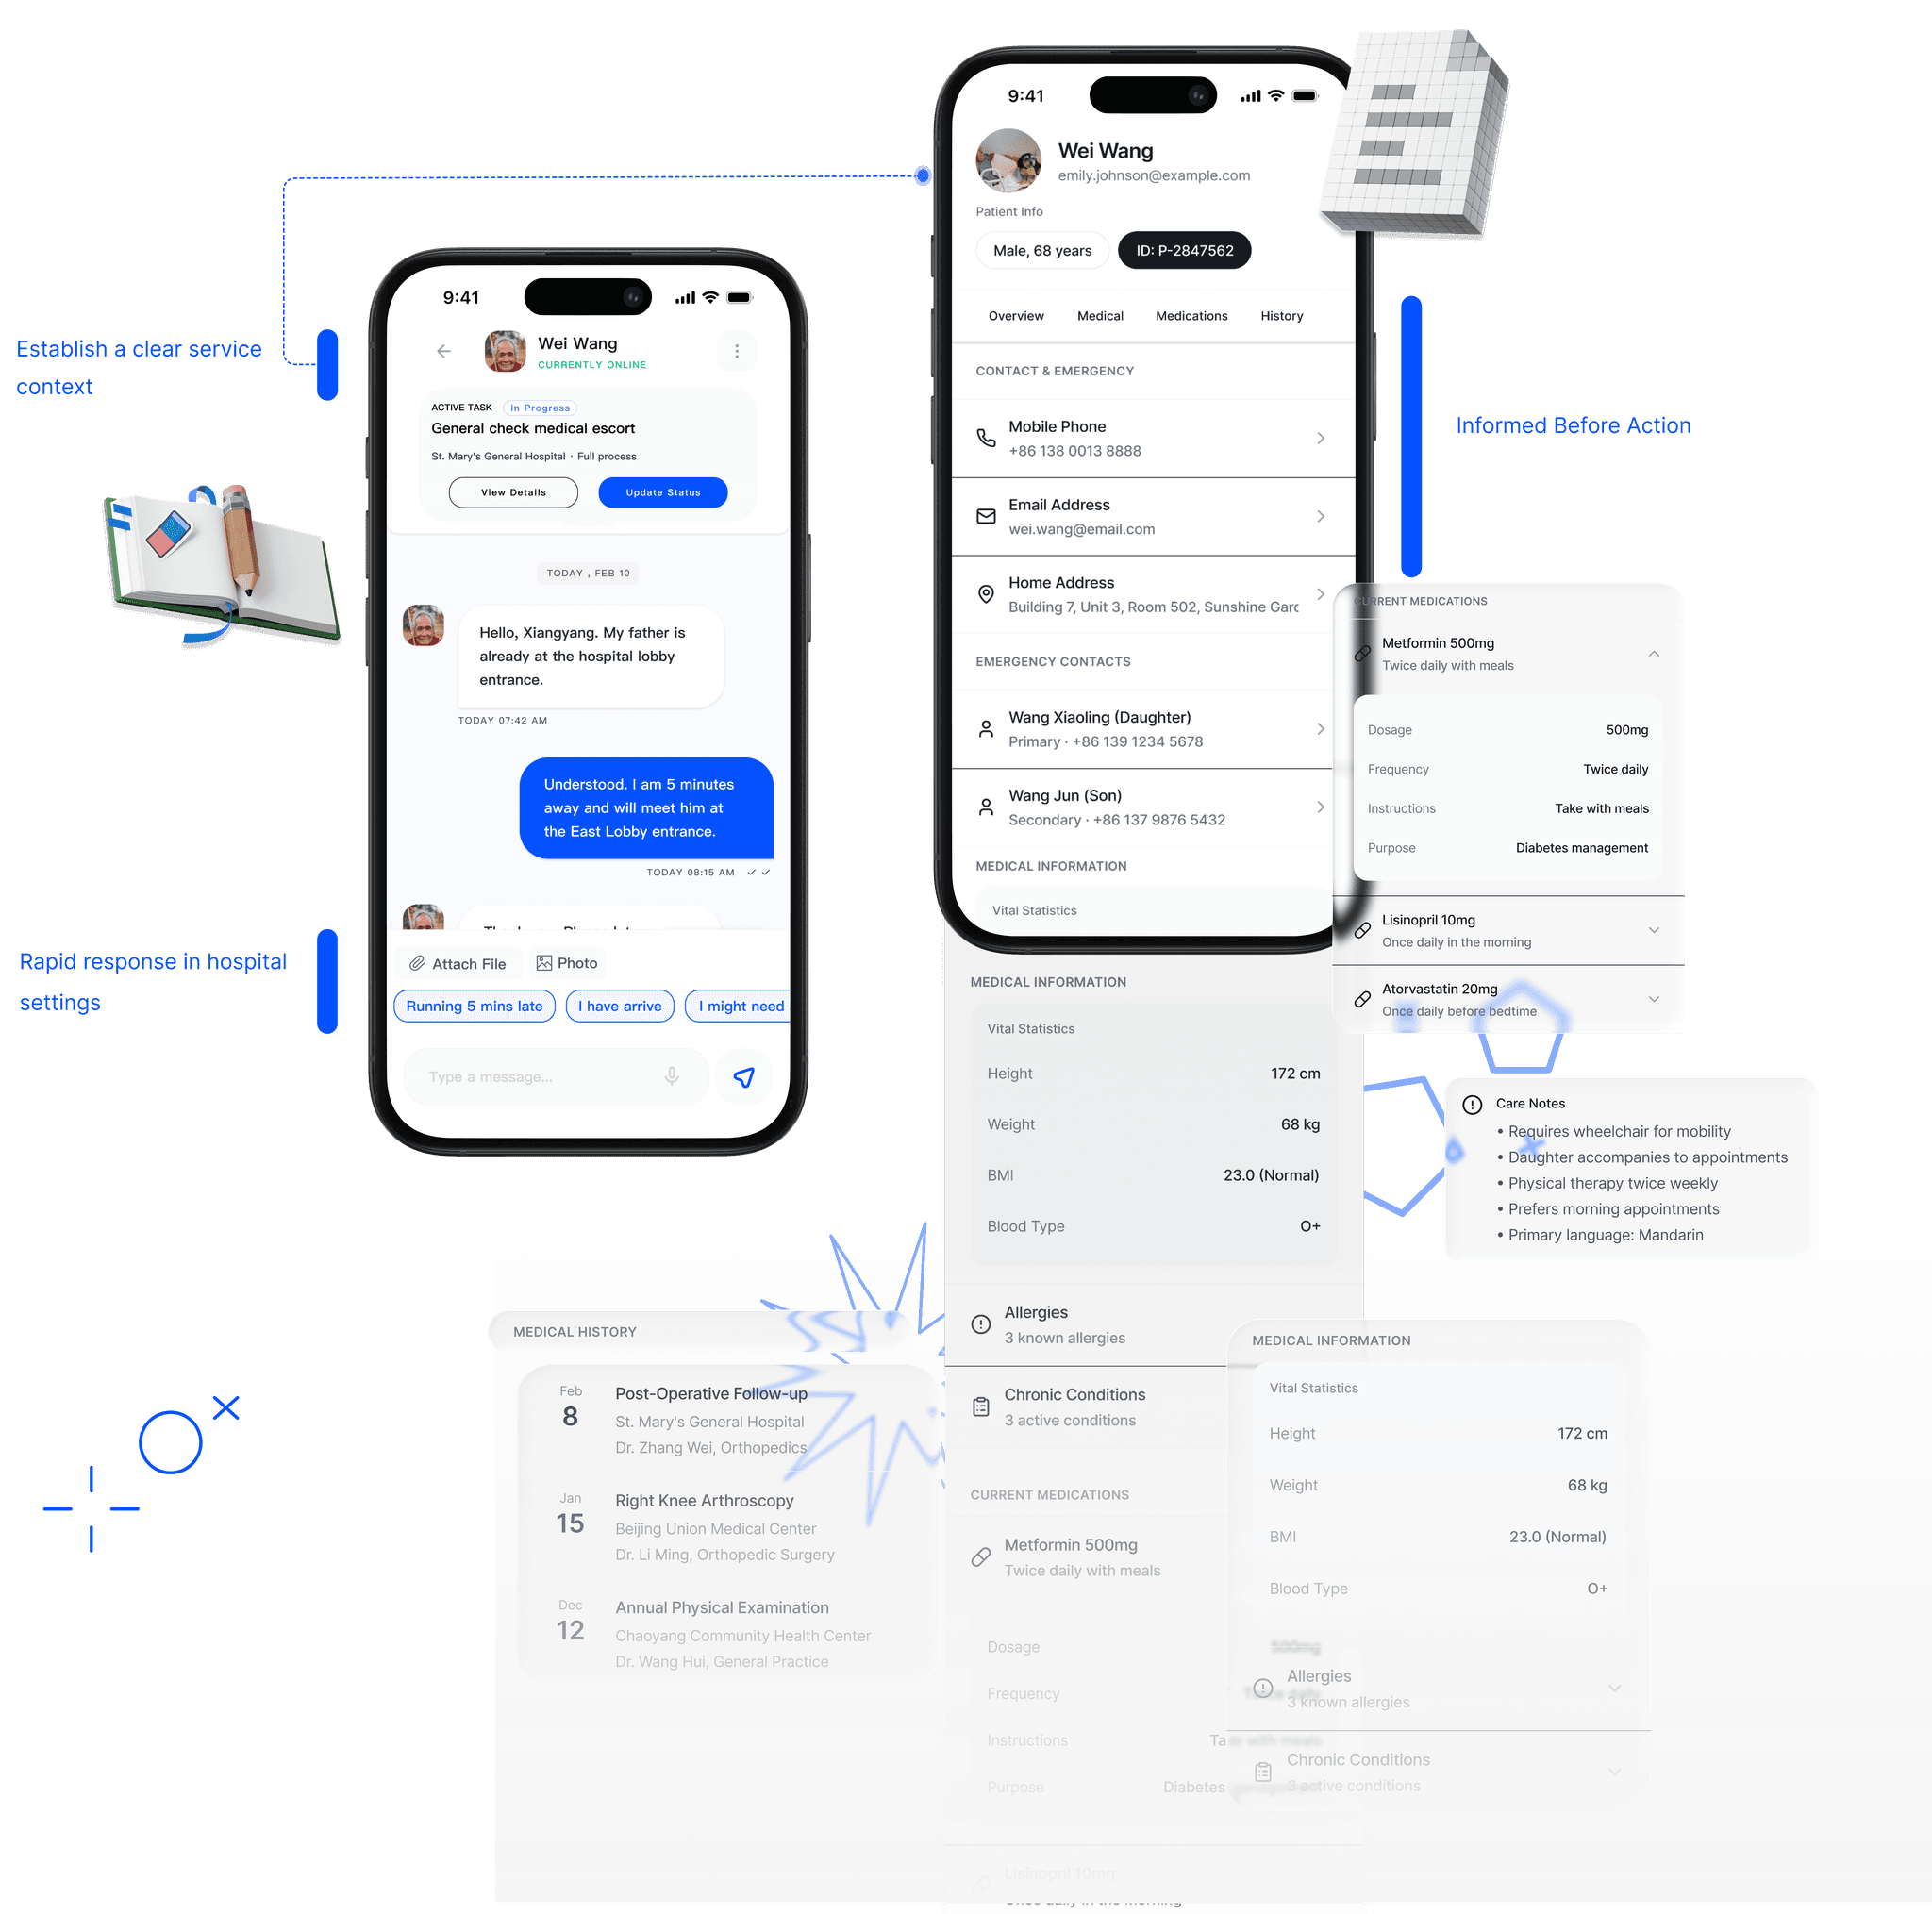
Connected. Informed. Reassured.
Care continues through clear communication and complete visibility. From real-time messages to detailed patient profiles, navigators stay aligned with families and informed on site.
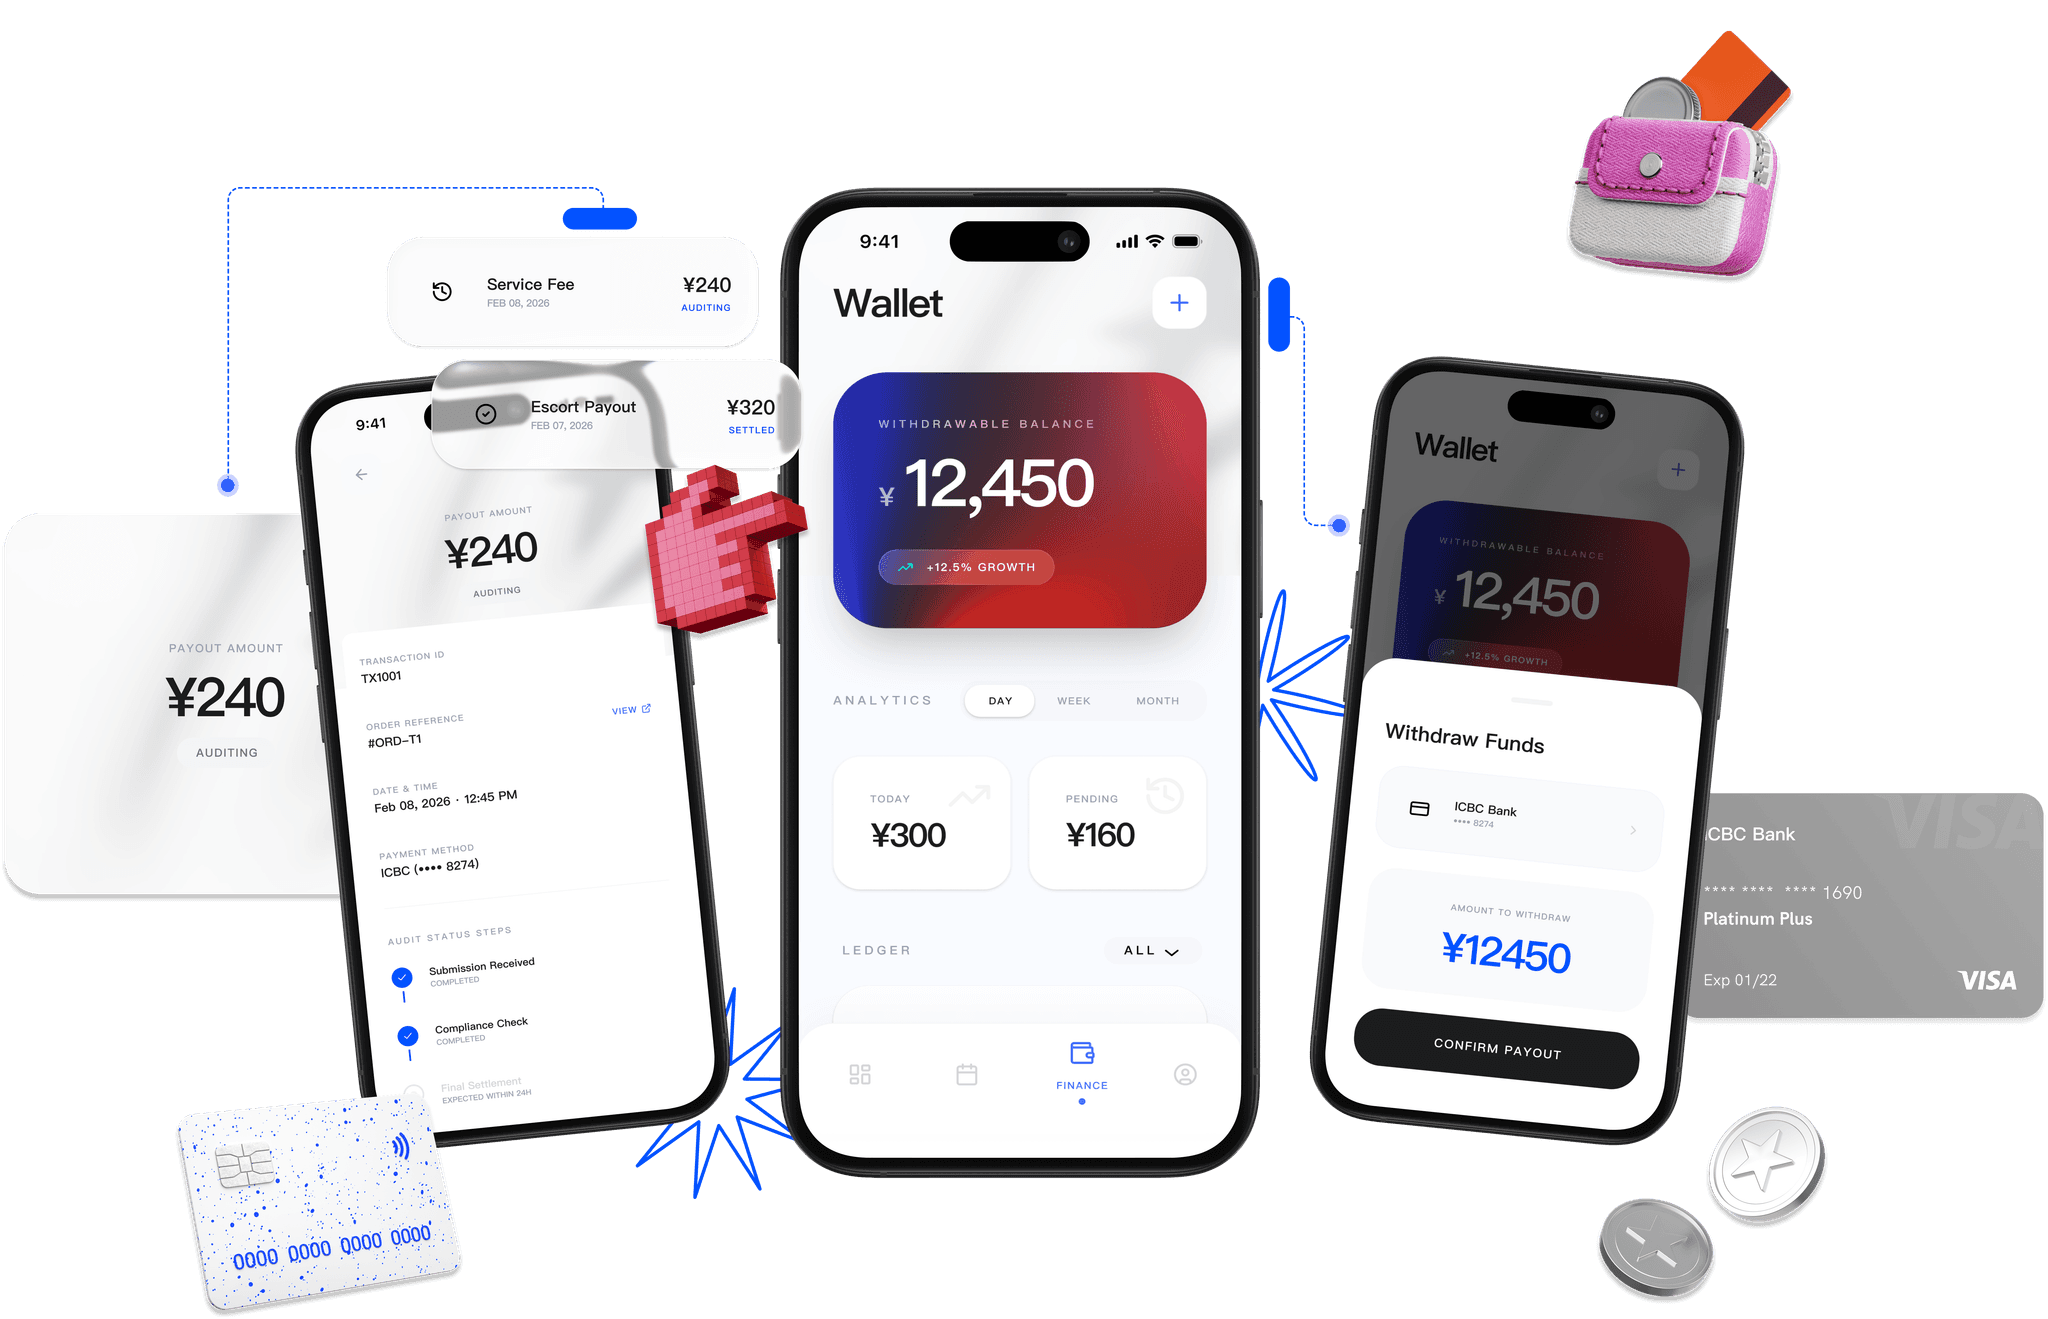
Earned. Tracked. Delivered.
Every navigator deserves transparent reward. The finance hub shows earnings from service payouts to withdrawable balance: no hidden steps, just clarity from work completed to funds received.
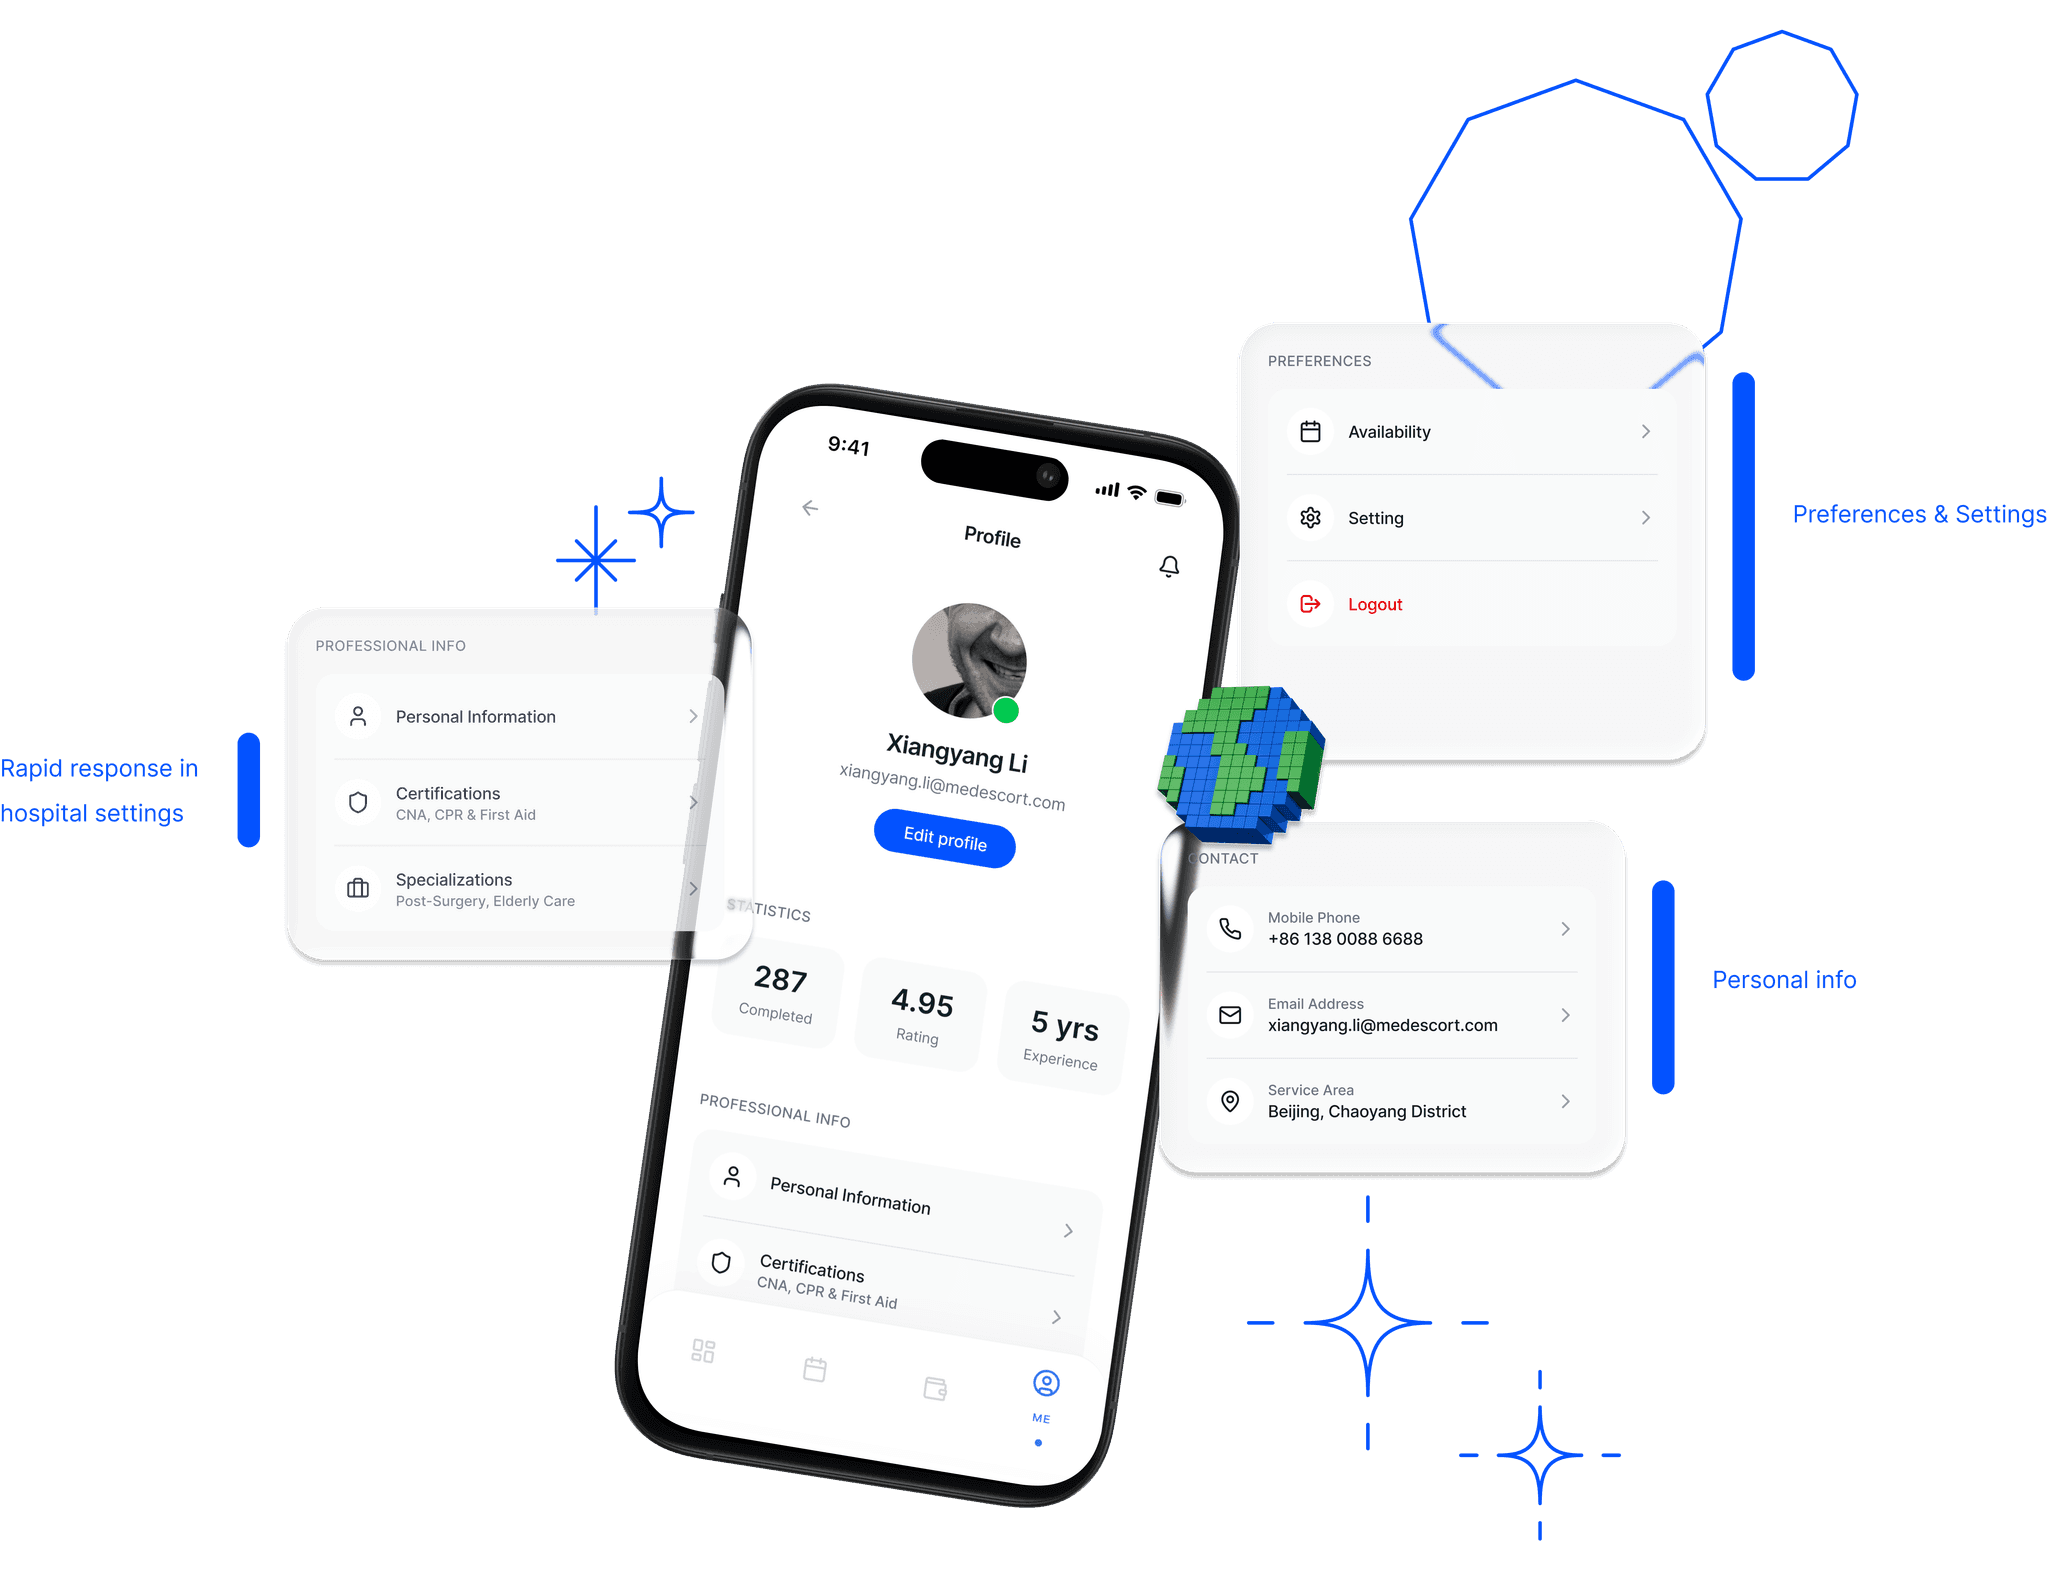
Built on care. Proven by experience.
Behind every service is a trained, trusted caregiver. The profile brings together credentials, certifications, service statistics and specializations, from years of experience to real-time availability.
Next On